What are Ranson’s criteria?
Ranson’s criteria are one of the oldest prognostic scoring systems in gastroenterology. They were described by the American surgeon John H. C. Ranson and colleagues in 1974 (Surg Gynecol Obstet. 1974;139:69-81), based on a series of patients admitted with acute pancreatitis, with further work on the subject published in 1979 (Ann Surg. 1979;189:205-208). The aim was a practical one: to identify, early in the course of the illness, which patients were most likely to die, so that monitoring and treatment could be matched to risk.
The system uses eleven clinical and laboratory signs. Five are measured at the time of admission and six are measured 48 hours later. Each sign that is present scores one point, so the total ranges from 0 to 11. In Ranson’s original series, mortality rose steeply with the number of signs present: patients with 0 to 2 signs had a mortality of about 0 to 3 percent, while patients with 7 or more signs had a mortality approaching 100 percent. That striking gradient is what made the criteria famous, and it is why they are still taught to medical students and junior doctors today.
It is important to understand what the score does and what it does not do. It does not diagnose pancreatitis. The diagnosis rests on the clinical picture, a raised serum lipase or amylase, and imaging such as contrast enhanced CT. Ranson’s criteria estimate prognosis, which means the likely course of an illness that has already been diagnosed. The mortality figures attached to the score also come from a single historical series of patients treated in the 1970s, long before modern intensive care, early enteral nutrition and minimally invasive management of pancreatic necrosis became standard. Outcomes today are better across the board, so the bands are best read as a rough ordering of risk rather than as a prediction for any individual patient.
The 11 prognostic signs
The eleven signs fall naturally into two groups. The admission signs capture how sick the patient looks on arrival: older age, a marked inflammatory response, stress hyperglycaemia and evidence of tissue injury in the liver enzymes and LDH. The 48-hour signs capture how the illness evolves: fluid leaking out of the circulation, kidneys coming under strain, calcium falling, lungs struggling and acid building up in the blood. Together they paint a picture of a systemic illness rather than a purely local one, which is exactly what severe acute pancreatitis is.
| Sign | Cutoff (1 point if met) | Timing |
|---|---|---|
| Age | Over 55 years | At admission |
| White blood cell count | Over 16,000 per mm³ | At admission |
| Blood glucose | Over 200 mg/dL (over 11.1 mmol/L) | At admission |
| Serum AST | Over 250 IU/L | At admission |
| Serum LDH | Over 350 IU/L | At admission |
| Fall in haematocrit | Over 10 percentage points | At 48 hours |
| Rise in blood urea nitrogen (BUN) | Over 5 mg/dL (over 1.8 mmol/L) | At 48 hours |
| Serum calcium | Under 8 mg/dL (under 2.0 mmol/L) | At 48 hours |
| Arterial oxygen tension (PaO2) | Under 60 mmHg | At 48 hours |
| Base deficit | Over 4 mEq/L | At 48 hours |
| Estimated fluid sequestration | Over 6 litres | At 48 hours |
A few of these deserve a brief explanation. The haematocrit fall is measured in percentage points, not as a percentage change: a fall from 45 percent to 33 percent is a fall of 12 points and therefore scores. It reflects plasma leaking out of the circulation into the tissues and the retroperitoneum, which concentrates the remaining red cells at first and then falls as intravenous fluid is given. The BUN rise reflects the kidneys struggling in the face of that volume loss. The calcium fall is classically attributed to calcium being deposited in areas of fat necrosis around the pancreas, a process sometimes called saponification. The low PaO2 warns of the acute respiratory distress syndrome, a feared complication of severe pancreatitis, while the base deficit signals tissue hypoperfusion. Fluid sequestration is the clinician’s estimate of how much fluid has been lost into the so called third space, and it is the most subjective of the eleven signs.
How to use this calculator
Start with the five admission values. Enter the patient’s age in years, the white cell count in cells per cubic millimetre, the blood glucose, the AST and the LDH. For glucose you may enter the value in either mg/dL or mmol/L using the unit selector; the calculator converts mmol/L to mg/dL by multiplying by 18 before applying the cutoff of 200 mg/dL. As you type, the admission subtotal updates immediately.
At 48 hours, enter the six later signs. The haematocrit fall and the BUN rise are changes from the admission value, not absolute levels: a BUN that climbs from 14 mg/dL to 22 mg/dL is a rise of 8 mg/dL and scores one point. BUN may be entered in mg/dL or mmol/L (converted by multiplying by 2.8), and calcium in mg/dL or mmol/L (converted by multiplying by 4.008). Until any 48-hour value is entered, the calculator labels the result as provisional and shows only the admission subtotal, because the complete score cannot be known before 48 hours. Reassess at 48 hours for the full eleven point total.
Every cutoff is applied strictly as Ranson described it. A glucose of exactly 200 mg/dL does not score, because the criterion is over 200 mg/dL; a calcium of exactly 8 mg/dL does not score, because the criterion is under 8 mg/dL. The breakdown list under the result shows each sign, the value you entered and whether it earned a point, so you can see exactly how the total was reached.
Interpreting the score
The total, from 0 to 11, maps to four bands. These bands and their mortality figures come directly from Ranson’s original series, and they are presented here honestly as historical estimates:
| Score | Mortality in the original series |
|---|---|
| 0 to 2 signs | About 0 to 3 percent |
| 3 to 4 signs | About 15 percent |
| 5 to 6 signs | About 40 percent |
| 7 or more signs | Approaching 100 percent |
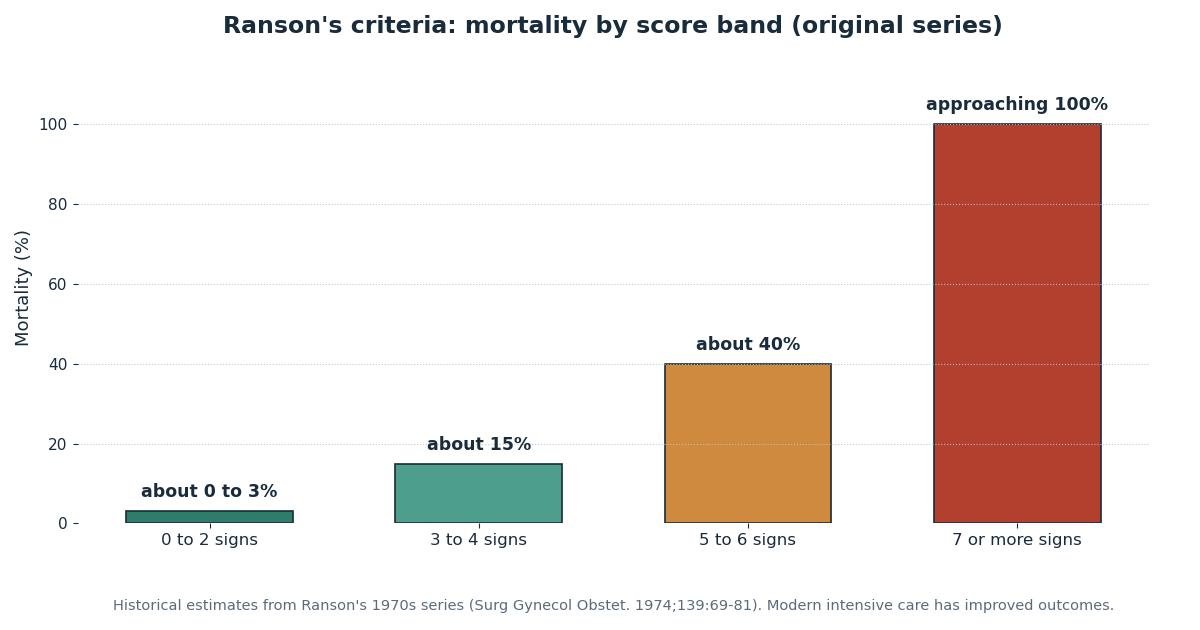
The practical reading is straightforward. A score of 0 to 2 suggests a mild attack that will usually settle with supportive care, though the patient still needs observation. A score of 3 or more marks a patient at substantially higher risk who warrants close monitoring, senior review and usually a higher level of care. A score of 5 or more indicates severe disease by any standard. But these bands describe groups, not individuals. A patient with 3 points may recover uneventfully while a patient with 1 point may still deteriorate, which is why the score informs vigilance rather than dictating decisions. Modern management, including aggressive but careful fluid resuscitation, early nutrition, antibiotics only when infection is proven or strongly suspected, and step up management of necrosis, has improved survival at every level of the score compared with the era in which these figures were collected.
A note on gallstone pancreatitis
The eleven cutoffs implemented in this calculator are the classic Ranson criteria, which were developed for non-gallstone pancreatitis. Gallstone pancreatitis behaves somewhat differently, and a modified set of Ranson criteria for gallstone pancreatitis exists with slightly different cutoffs. To be clear about what this page does: it implements the classic non-gallstone criteria only. If the pancreatitis is caused by gallstones, these cutoffs should not be applied unmodified. In that situation, follow whichever prognostic score your local team uses and document which version was applied.
Worked example
Consider a 62 year old man admitted with acute pancreatitis. At admission his white cell count is 18,500 per mm³, his glucose is 240 mg/dL, his AST is 310 IU/L and his LDH is 420 IU/L. That is five admission points: one each for age, white cells, glucose, AST and LDH. At 48 hours his haematocrit has fallen 12 percentage points, his BUN has risen 8 mg/dL, his calcium is 7.4 mg/dL, his PaO2 is 58 mmHg, his base deficit is 5 mEq/L and his estimated fluid sequestration is 7 litres. That is six further points, one for each 48-hour sign. The total is 11, placing him in the highest band. In Ranson’s original series this band carried a mortality approaching 100 percent, a figure that underlines how grave such a presentation was considered, even though modern care would be expected to do better.
Contrast that with a 40 year old woman whose only abnormality at admission is a white cell count of 17,000 per mm³, with normal glucose, AST and LDH, and whose 48-hour values all remain within their cutoffs. She scores 1 point in total, in the lowest band, consistent with a mild attack likely to resolve with supportive care.
Limitations and other prognostic scores
Ranson’s criteria have real limitations, and an honest account should state them. The most obvious is time: the full score cannot be completed until 48 hours after admission, which is late if the purpose is to triage a patient on arrival. The fluid sequestration estimate is subjective and varies between observers. The score was derived from a relatively small historical cohort, and its mortality figures predate modern intensive care. It also performs best as a population tool; applied to a single patient it is a rough guide at best.
Several alternative scores address some of these weaknesses. The Glasgow, or Imrie, score uses eight criteria measured within the first 48 hours and was developed specifically for pancreatitis. BISAP uses five criteria that can all be assessed at admission, which makes it more convenient for early bedside triage. APACHE II is a general intensive care severity score rather than a pancreatitis specific one, and it is considerably more complex to calculate. Local and national guidelines may favour one of these over Ranson’s criteria, and practice varies between centres. For readers working through our gastroenterology calculators, the consistent advice is the same: use a prognostic score as one input among many, alongside the patient’s trajectory, imaging findings and the judgement of the treating team.
Key takeaways
- Ranson's criteria are eleven clinical and laboratory signs used to estimate the prognosis of acute pancreatitis.
- At admission: age over 55 years, white cell count over 16,000 per cubic millimetre, blood glucose over 200 mg/dL, serum AST over 250 IU/L, and serum LDH over 350 IU/L.
- In Ranson's original series, patients with 0 to 2 signs had a mortality of about 0 to 3 percent, those with 3 to 4 signs about 15 percent, those with 5 to 6 signs about 40 percent, and those with 7 or more signs approaching 100 percent.
- The classic criteria above were developed for non-gallstone pancreatitis.
Frequently asked questions
What are Ranson's criteria used for?
Ranson's criteria are eleven clinical and laboratory signs used to estimate the prognosis of acute pancreatitis. Five signs are assessed at admission and six at 48 hours. Each sign present scores one point, giving a total from 0 to 11. Higher scores were associated with higher mortality in Ranson's original series, so the score helps clinicians gauge how closely a patient needs to be monitored. It is a prognostic aid, not a diagnostic test, and it never replaces clinical judgement.
What are the 11 Ranson criteria?
At admission: age over 55 years, white cell count over 16,000 per cubic millimetre, blood glucose over 200 mg/dL, serum AST over 250 IU/L, and serum LDH over 350 IU/L. At 48 hours: haematocrit fall over 10 percentage points, BUN rise over 5 mg/dL, serum calcium under 8 mg/dL, PaO2 under 60 mmHg, base deficit over 4 mEq/L, and estimated fluid sequestration over 6 litres. This calculator implements the classic criteria for non-gallstone pancreatitis.
What does a Ranson score of 3 or more mean?
In Ranson's original series, patients with 0 to 2 signs had a mortality of about 0 to 3 percent, those with 3 to 4 signs about 15 percent, those with 5 to 6 signs about 40 percent, and those with 7 or more signs approaching 100 percent. A score of 3 or more therefore marked a substantially worse outlook in that series. These are historical figures from the 1970s, and modern intensive care has improved outcomes, so they should be read as a rough guide rather than a prediction for any individual patient.
Can Ranson's criteria be used for gallstone pancreatitis?
The classic criteria above were developed for non-gallstone pancreatitis. A modified set of Ranson criteria for gallstone pancreatitis exists with slightly different cutoffs. This calculator implements the classic non-gallstone criteria only, so it should not be applied unmodified to gallstone pancreatitis. If the cause is gallstone related, ask the treating team which prognostic score they use.
When should the 48-hour Ranson signs be measured?
The six 48-hour signs, including the haematocrit fall, BUN rise and fluid sequestration, are assessed 48 hours after admission. Until then only the five admission signs can be scored, and the calculator labels such a result as provisional. Reassess at 48 hours for the complete score.
Are Ranson's criteria still used today?
Ranson's criteria are still taught and still appear in research, but in day to day practice many clinicians prefer scores that can be completed at admission, such as BISAP, or general severity scores such as APACHE II. A practical limitation of Ranson's criteria is that the full score takes 48 hours to complete. They remain a useful teaching tool and a reasonable prognostic aid when their limits are understood.