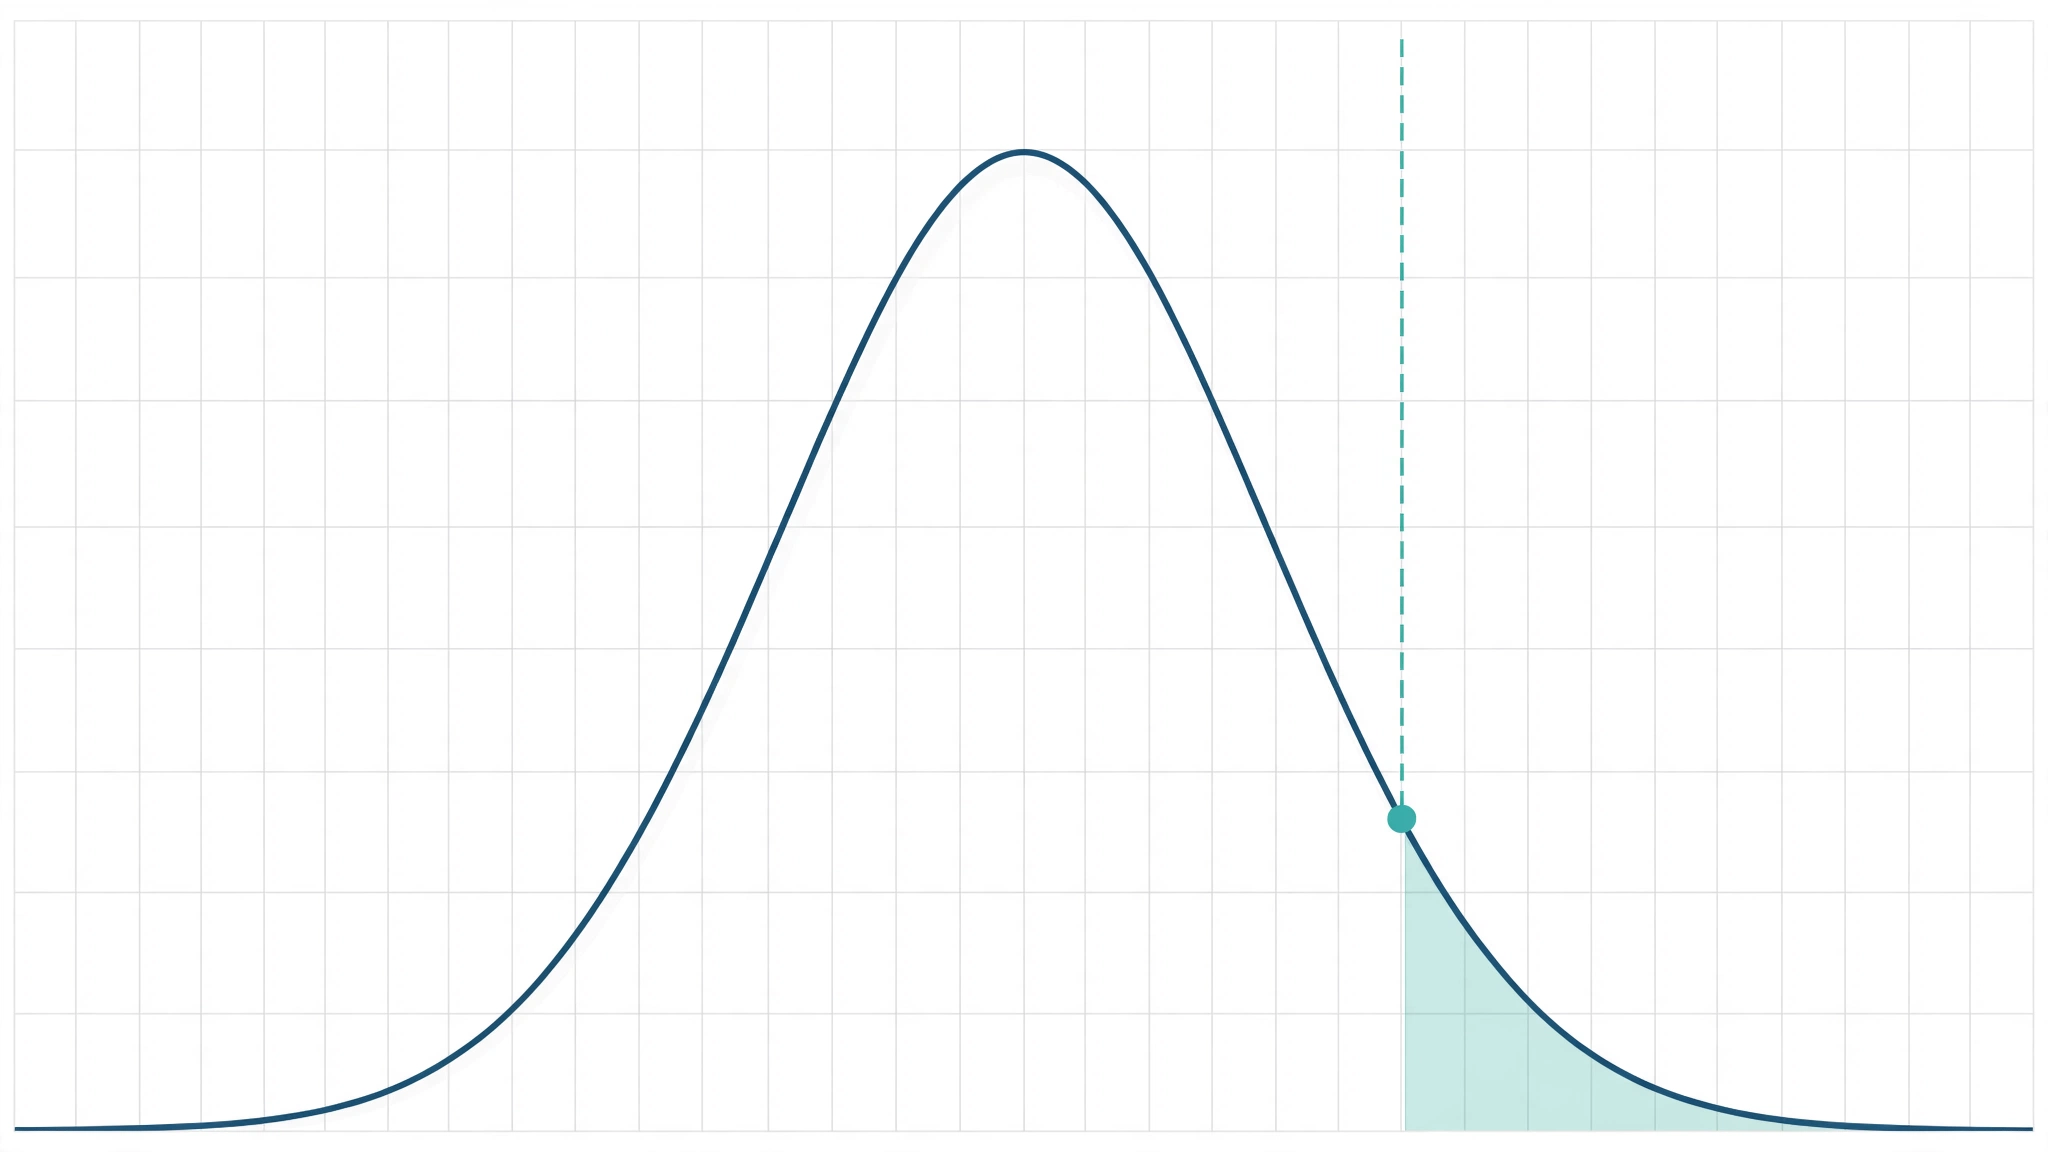
In a study I worked on, we compared self-medication practice between medical and non-medical students and got p = .117. A surprising number of readers translate that into “there is no difference between the groups.” That translation is wrong, and it is one of the most common errors in reading research. A non-significant p-value means the data did not provide enough evidence to detect an association. It does not prove the association is zero. Here is how to read results like p = .117 without fooling yourself.
If p-values themselves feel fuzzy, start with my plain-English guide to what a p-value actually is, then come back. This post builds on it.
What a non-significant p-value actually claims
Take our result at face value. A p-value of .117 means: if there were truly no association between discipline and self-medication practice, data like ours (or more extreme) would turn up about 11.7% of the time by chance alone. That is not rare enough to reject the null hypothesis at the conventional .05 level. Full stop. That is the entire claim.
Our paper worded it the way every paper should: “no statistically detectable association. This does not prove equivalence.” The second sentence is doing heavy lifting. “Not detected” describes the limits of our evidence. “Does not exist” would describe reality, which we did not measure.
Absence of evidence is not evidence of absence
The same study makes the contrast beautifully. Familiarity with the term self-medication differed clearly between groups: 94.8% of medical versus 87.1% of non-medical students, p < .001. Risk awareness: 88.0% versus 72.5%, p < .001. Same students, same questionnaire, same analysis. Two differences we could detect, one we could not.
It would be strange to treat the third result as stronger knowledge than the first two. Yet that is what “no difference” does. It upgrades a failure to detect into a positive claim about the world.
Three mistakes people make with p = .117
1. “There is no difference.” Covered above. Wrong.
2. “It trends toward significance.” P-values do not trend. A p-value of .117 is not “almost significant” the way 49 is almost 50. The .05 line is a convention, not a cliff edge, and .117 sits on the non-rejecting side of it. Describing it as “marginally significant” or “approaching significance” is just significance testing with better public relations.
3. Ignoring what the test could even see. With 699 students, our study had reasonable ability to pick up large associations. A small true difference between groups could easily hide inside p = .117. Non-significance always has two parents: possibly no effect, possibly an effect too small for this sample to resolve. The p-value alone never tells you which one showed up.
What to look at instead
Effect sizes and confidence intervals. They answer the question the p-value dodges: if there is an association, how big might it be? A narrow interval around zero is genuinely reassuring. A wide interval that includes both zero and meaningful values is the statistical equivalent of a shrug.
I will be honest about our own paper here: it reported few effect sizes or confidence intervals, and the comparisons were unadjusted. That is a limitation, stated in the manuscript. It also means a careful reader should hold our p = .117 lightly, in both directions.
And apply the same skepticism to significant results. The familiarity gap (94.8% vs 87.1%, p < .001) is statistically decisive, but is 7.7 percentage points practically important? Significance never answers that either.
A reader’s checklist for non-significant results
- Read “not significant” as “not detected,” never as “not there.”
- Ask about power: was the study big enough to find a meaningful effect if one existed?
- Look for the confidence interval. Wide intervals mean uncertainty, not equality.
- Distrust “trend toward significance.” It is a non-result wearing a lab coat.
- Check whether the authors adjusted for confounders. Ours did not, which is another reason for caution.
The p-value is a tool for flagging surprise, not a verdict on reality. Treat p = .117 as what it is: the data shrugging. Your job as a reader is to shrug back, carefully.
This article discusses the interpretation of published research findings. It is educational content, not medical or statistical advice for any specific study.