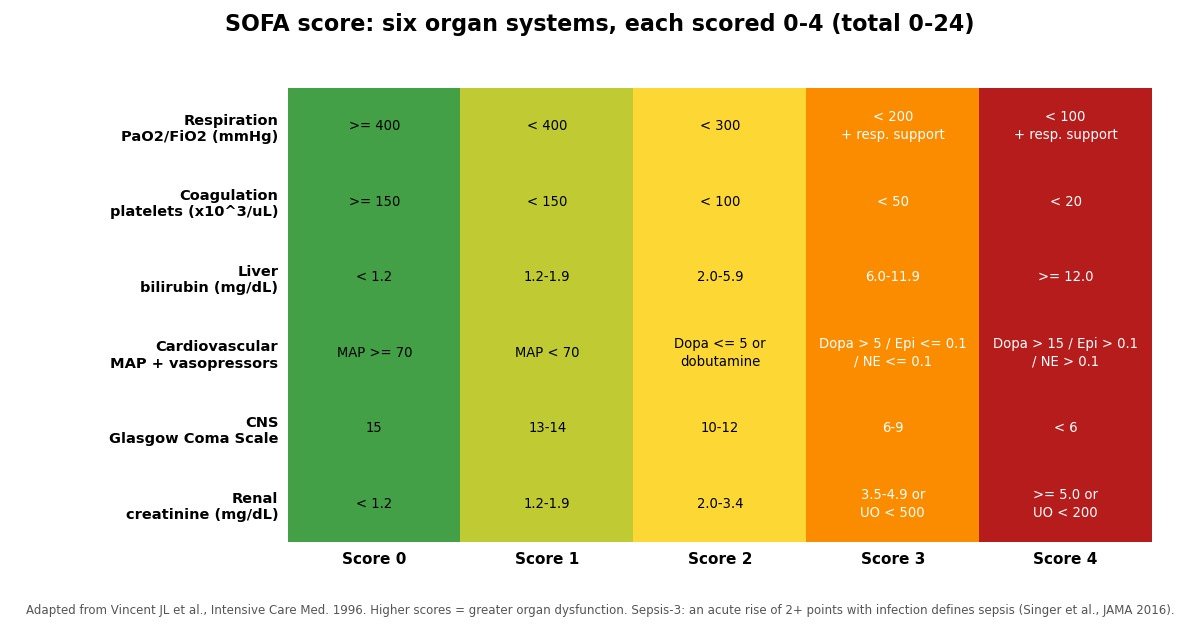
What the SOFA score is
The Sequential Organ Failure Assessment, universally known as the SOFA score, is the standard bedside instrument for describing how badly a critically ill patient's organs are failing. It was developed by a working group of the European Society of Intensive Care Medicine led by Jean-Louis Vincent and published in 1996 in the journal Intensive Care Medicine. The name matters: the score is sequential, meaning it is meant to be repeated, and it assesses organ failure rather than predicting death. Six organ systems are each graded from 0 (normal) to 4 (severe failure), and the six sub-scores are added to give a total between 0 and 24. A higher total means more extensive organ dysfunction. The instrument was derived and validated in adult intensive care units, and that setting is where it belongs: SOFA scores are computed from the worst value of each variable recorded during a 24-hour period, usually the preceding day, so that the daily totals trace the patient's trajectory through the ICU stay.
The SOFA score gained a second life in 2016, when the Third International Consensus Definitions for Sepsis and Septic Shock, known as Sepsis-3, adopted it as the operational definition of sepsis. The Sepsis-3 task force, led by Mervyn Singer and published in JAMA, defined sepsis as life-threatening organ dysfunction caused by a dysregulated host response to infection, and defined organ dysfunction as an acute increase in the SOFA score of 2 or more points consequent to the infection. In the large hospital cohorts used to derive that definition, this threshold was associated with an overall in-hospital mortality of more than 10 percent. That one sentence made SOFA the most widely used severity instrument in sepsis care and research worldwide, and it is the reason most clinicians outside the ICU now meet the score.
The six organ systems, in detail
1. Respiration: the PaO2/FiO2 ratio
Oxygenation is graded with the ratio of arterial oxygen partial pressure (PaO2) to the fraction of inspired oxygen (FiO2), expressed in mmHg. A healthy adult breathing room air has a ratio around 400 to 500; the score awards 0 points at 400 or above, 1 point below 400, and 2 points below 300. The higher bands of 3 and 4 points carry an extra condition: they apply only when the patient is on respiratory support, because a very low ratio in a patient breathing spontaneously is scored as 2. Concretely, a ratio below 200 with respiratory support scores 3, and a ratio below 100 with respiratory support scores 4, while the same ratios without support score 2. The support condition reflects the original study, which required mechanical ventilation for the top two bands. In practice, worsening oxygenation is often the first organ system to deteriorate in sepsis and pneumonia, which is why the respiratory sub-score is frequently the highest component in medical ICUs.
2. Coagulation: platelet count
The coagulation sub-score uses the platelet count in thousands per microlitre. Counts of 150 or more score 0; below 150 scores 1; below 100 scores 2; below 50 scores 3; and below 20 scores 4. Platelets fall in critical illness for many reasons: consumption in disseminated intravascular coagulation, dilution from large-volume fluid resuscitation, reduced production in liver failure, and immune-mediated destruction. In sepsis, a falling platelet count is one of the earliest laboratory signs of a dysregulated host response, and the coagulation sub-score often rises before overt bleeding appears. Heparin-induced thrombocytopenia and haematological malignancies can depress platelets for reasons unrelated to the acute illness, which is worth remembering when a patient arrives in the ICU with a chronically low count.
3. Liver: bilirubin
Hepatic dysfunction is captured by total bilirubin in mg/dL. Below 1.2 scores 0; 1.2 to 1.9 scores 1; 2.0 to 5.9 scores 2; 6.0 to 11.9 scores 3; and 12.0 or more scores 4. Bilirubin rises in critical illness through a mixture of mechanisms: reduced hepatic blood flow during shock, cholestasis of sepsis, haemolysis from transfusions or devices, and direct hepatocellular injury. The liver sub-score tends to move more slowly than the respiratory or cardiovascular components, and isolated hyperbilirubinaemia should prompt a search for a surgical or obstructive cause rather than being attributed to the critical illness by default. Patients with chronic liver disease carry a baseline elevation that complicates interpretation of an acute rise, which is one reason Sepsis-3 emphasises the change from baseline rather than the absolute total.
4. Cardiovascular: blood pressure and vasopressor dose
The cardiovascular sub-score is the most intricate of the six, because it combines mean arterial pressure (MAP) with the doses of vasoactive drugs. A MAP of 70 mmHg or more with no vasopressor support scores 0, and a MAP below 70 scores 1. Once drugs enter the picture, the dose determines the score: dopamine at 5 mcg/kg/min or less, or dobutamine at any dose, scores 2; dopamine above 5, or epinephrine or norepinephrine at 0.1 mcg/kg/min or less, scores 3; and dopamine above 15, or epinephrine or norepinephrine above 0.1 mcg/kg/min, scores 4. When both a low MAP and vasopressors are present, the drug-based score takes precedence, which is why this calculator uses the worse of the two. The hierarchy reflects clinical reality: needing escalating vasopressor doses to maintain perfusion signals deeper cardiovascular failure than hypotension alone. Dopamine has largely fallen out of favour in modern practice in favour of norepinephrine as the first-line vasopressor, but the original thresholds are retained so that scores remain comparable with the historical literature.
5. Central nervous system: the Glasgow Coma Scale
Brain dysfunction is graded with the Glasgow Coma Scale (GCS), the 3-to-15 scale familiar from head-injury assessment. A GCS of 15 scores 0; 13 to 14 scores 1; 10 to 12 scores 2; 6 to 9 scores 3; and below 6 scores 4. The score uses the best (highest) GCS of the 24-hour window, which is the opposite convention from most of the other components. The CNS sub-score has a well-known weakness: sedation, which is routine in ventilated ICU patients, depresses the GCS and can make brain dysfunction look worse than it is. For that reason, many units record the GCS before sedation where possible, or interpret the CNS component cautiously in deeply sedated patients. Delirium, the commonest form of acute brain dysfunction in the ICU, may not be fully captured by the GCS either, since a quietly delirious patient can still score 15.
6. Renal: creatinine or urine output
Kidney function is assessed by serum creatinine in mg/dL or by daily urine output, whichever gives the worse score. Creatinine below 1.2 scores 0; 1.2 to 1.9 scores 1; 2.0 to 3.4 scores 2; 3.5 to 4.9 scores 3; and 5.0 or more scores 4. A urine output below 500 mL per day scores 3 and below 200 mL per day scores 4, mirroring the definitions of oliguria and anuria. Using the worse of the two matters because they can diverge: creatinine lags behind real-time kidney injury by hours, while urine output responds within the hour but is confounded by diuretics and fluid balance. Patients with chronic kidney disease start from an elevated baseline, so as with the liver, the acute change carries more meaning than the absolute number.
How to use the score well
The SOFA score earns its keep through repetition. Compute it once daily from the worst values of the preceding 24 hours, plot the totals, and read the trend rather than any single number. A total that falls day by day suggests resolving organ dysfunction and usually accompanies clinical improvement; a total that climbs, or that fails to fall during the first 48 hours of ICU care, has been associated with worse outcomes in published cohorts. Ferreira and colleagues demonstrated this serial value in JAMA in 2001: the trajectory of the score predicted outcome better than the admission score alone, and a rising score in the first two days signalled a poor course. For sepsis specifically, compare each day's total with the patient's baseline: an acute rise of 2 or more points in the setting of infection is the Sepsis-3 definition of sepsis itself, and the baseline may be assumed to be zero when there is no known pre-existing organ dysfunction.
A worked example makes the arithmetic concrete. Consider a patient with pneumonia whose PaO2/FiO2 is 240 on mechanical ventilation (2 points), platelets 90 x10^3 per microlitre (2 points), bilirubin 1.0 mg/dL (0 points), MAP 62 mmHg on norepinephrine 0.08 mcg/kg/min (3 points, driven by the drug dose), GCS 14 (1 point), and creatinine 1.6 mg/dL with a urine output of 800 mL per day (1 point from creatinine). The total is 9. If this patient's baseline SOFA two days earlier was 2, the acute rise of 7 points in the setting of infection identifies sepsis with substantial multi-organ dysfunction, and the daily totals from here will show whether the trajectory is improving or deteriorating.
SOFA, qSOFA, APACHE and SAPS: what each is for
Clinicians sometimes confuse SOFA with its bedside cousin qSOFA, the quick SOFA introduced in the same 2016 Sepsis-3 paper. The qSOFA uses just three bedside criteria, one point each: a Glasgow Coma Scale below 15, a systolic blood pressure of 100 mmHg or less, and a respiratory rate of 22 per minute or more. Two or more qSOFA points in a patient with suspected infection flag a higher risk of a poor outcome and should prompt closer evaluation. The qSOFA was designed for speed outside the ICU, in emergency departments and wards, where laboratory results are not yet available; it is a screening prompt, not a diagnostic instrument, and it does not replace the full SOFA score. The APACHE II and SAPS II scores, published in the 1980s and 1990s, take a different approach again: they combine physiology, age, and chronic health status into a single number calibrated to predict hospital mortality for groups of ICU patients. SOFA deliberately avoids that calibration. It describes how much organ dysfunction is present right now and how that is changing, which is exactly the information a clinician needs at the bedside and exactly what mortality models cannot provide day to day.
Units and conversions
The original 1996 publication expressed its thresholds in SI units: kilopascals for PaO2/FiO2 and micromoles per litre for bilirubin and creatinine. Most bedside calculators, including this one, use the conventional units common in clinical practice: mmHg for the PaO2/FiO2 ratio and mg/dL for bilirubin and creatinine. The conversion factors are 1 mmHg = 0.133 kPa, so the respiratory thresholds of 400, 300, 200 and 100 mmHg correspond to 53.3, 40.0, 26.7 and 13.3 kPa; 1 mg/dL of creatinine = 88.4 micromol/L; and 1 mg/dL of bilirubin = 17.1 micromol/L. Platelet thresholds are identical in either system, since 1 x10^3 per microlitre equals 1 x10^9 per litre. If your laboratory reports SI units, convert before entering values: a creatinine of 150 micromol/L is about 1.7 mg/dL, which sits in the 1-point band.
Limitations and common misuse
Every strength of the SOFA score comes with a boundary. It was developed and validated in adult intensive care units, so applying it to children, to ward patients, or to triage decisions outside critical care stretches it beyond its evidence base. The score is not a triage instrument and was never validated for deciding who receives ICU care. Sedation corrupts the GCS component, chronic organ failure inflates the baseline, and different ICUs titrate vasopressors to different MAP targets, which shifts the cardiovascular sub-score between centres. The score also treats all six systems as equal contributors, which is a simplification: in reality, the prognostic weight of each system differs by disease. Finally, and most importantly, SOFA describes dysfunction without diagnosing its cause. Two patients can both total 11 for entirely different reasons, and only clinical judgment about the underlying disease turns the number into a plan.