What the CRUSADE bleeding score is
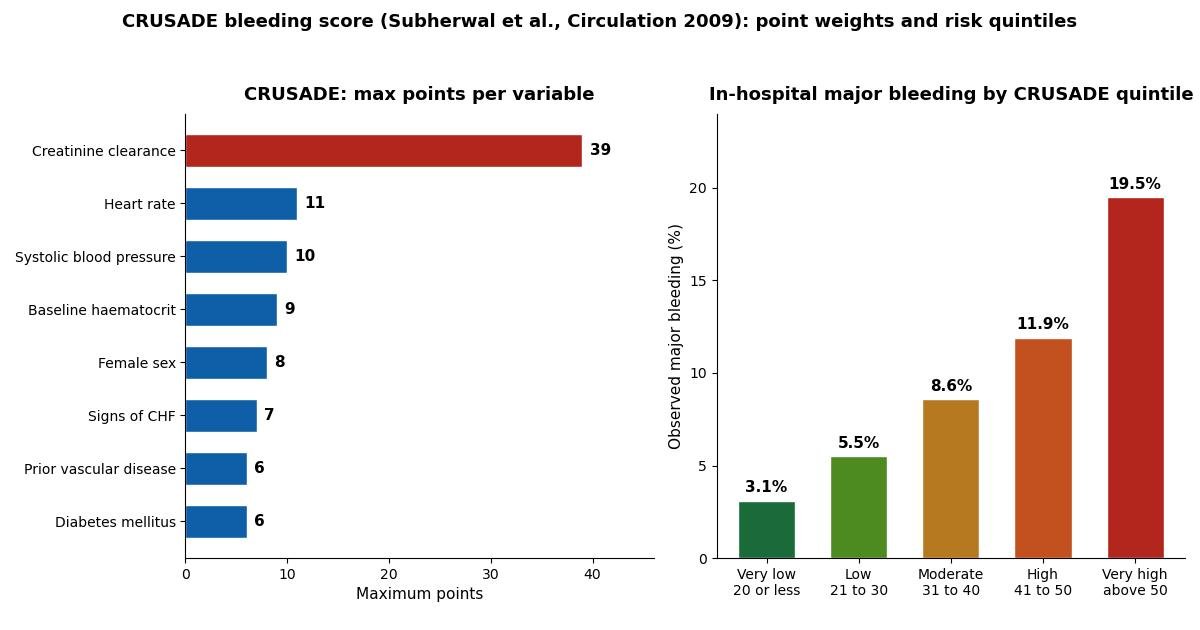
Patients admitted with non-ST-elevation myocardial infarction (NSTEMI) face two competing dangers: the ischaemic risk of the coronary event itself, and the bleeding risk introduced by the antithrombotic drugs and invasive procedures used to treat it. The CRUSADE bleeding score was developed to quantify the second of these risks at the bedside, using only information available at the time of presentation. It was published by Subherwal and colleagues in Circulation in 2009, derived from 71,277 patients and validated in a further 17,857 patients enrolled in the CRUSADE (Can Rapid risk stratification of Unstable angina patients Suppress ADverse outcomes with Early implementation of the ACC/AHA guidelines) Quality Improvement Initiative, a large United States registry of community-treated NSTEMI. From the registry data, eight independent baseline predictors of in-hospital major bleeding were identified, and each was assigned a weighted integer reflecting its coefficient in the reduced regression model. Adding the integers produces a score on a published scale of 1 to 100 points, which is grouped into five risk quintiles: very low, low, moderate, high, and very high. In the derivation cohort, the observed rate of in-hospital major bleeding rose steadily across the quintiles, from 3.1 percent in the very low risk group to 19.5 percent in the very high risk group, with a highly significant trend (P less than 0.001). The score separated bleeders from non-bleeders with a c-statistic of 0.71 in the derivation cohort and 0.70 in the validation cohort.
How the score is calculated
The calculator above implements the published CRUSADE point tables exactly. Each of the eight baseline variables is converted into points using the bands in the table below, and the points are summed to give the total score. Because systolic blood pressure always contributes at least 1 point, the lowest achievable total is 1 point; the highest achievable total is 96 points, even though the published scale is described as running from 1 to 100. In the derivation cohort, the highest score actually observed was 91. The point bands are reproduced verbatim from the original nomogram: baseline haematocrit below 31 percent earns 9 points, 31 to 33.9 percent earns 7, 34 to 36.9 percent earns 3, 37 to 39.9 percent earns 2, and 40 percent or above earns 0; creatinine clearance of 15 mL/min or below earns 39 points, above 15 to 30 earns 35, above 30 to 60 earns 28, above 60 to 90 earns 17, above 90 to 120 earns 7, and above 120 earns 0; heart rate of 70 beats per minute or below earns 0, 71 to 80 earns 1, 81 to 90 earns 3, 91 to 100 earns 6, 101 to 110 earns 8, 111 to 120 earns 10, and 121 or above earns 11; female sex earns 8 points; signs of congestive heart failure at presentation earn 7; prior vascular disease earns 6; diabetes mellitus earns 6; and systolic blood pressure of 90 mmHg or below earns 10 points, 91 to 100 earns 8, 101 to 120 earns 5, 121 to 180 earns 1, 181 to 200 earns 3, and 201 or above earns 5. Note that the score uses only values obtainable at presentation, which is why it can guide the very first treatment decisions, including the choice and dosing of antithrombotic therapy before the patient reaches the catheterisation laboratory.
The eight predictors and their point values
The table below lists every band and its points, exactly as published. Prior vascular disease is defined as a history of peripheral artery disease or stroke. Creatinine clearance is calculated with the Cockcroft-Gault formula.
| Predictor | Band | Points |
|---|---|---|
| Baseline haematocrit (%) | Below 31 | 9 |
| 31 to 33.9 | 7 | |
| 34 to 36.9 | 3 | |
| 37 to 39.9 | 2 | |
| 40 or above | 0 | |
| Creatinine clearance (mL/min) | 15 or below | 39 |
| Above 15 to 30 | 35 | |
| Above 30 to 60 | 28 | |
| Above 60 to 90 | 17 | |
| Above 90 to 120 | 7 | |
| Above 120 | 0 | |
| Heart rate (beats/min) | 70 or below | 0 |
| 71 to 80 | 1 | |
| 81 to 90 | 3 | |
| 91 to 100 | 6 | |
| 101 to 110 | 8 | |
| 111 to 120 | 10 | |
| 121 or above | 11 | |
| Sex | Female | 8 |
| Male | 0 | |
| Signs of congestive heart failure at presentation | Yes | 7 |
| No | 0 | |
| Prior vascular disease | Yes | 6 |
| No | 0 | |
| Diabetes mellitus | Yes | 6 |
| No | 0 | |
| Systolic blood pressure (mmHg) | 90 or below | 10 |
| 91 to 100 | 8 | |
| 101 to 120 | 5 | |
| 121 to 180 | 1 | |
| 181 to 200 | 3 | |
| 201 or above | 5 |
A striking feature of the weighting is that renal function dominates: a creatinine clearance of 15 mL/min or below contributes 39 points on its own, more than any other single variable. Low baseline haematocrit and very low systolic blood pressure are the next strongest contributors. This pattern reflects the biology of bleeding in acute coronary care: anaemia reduces the reserve before a bleed becomes clinically important, renal impairment prolongs the effect of renally cleared antithrombotics, and hypotension often marks haemodynamic instability and more aggressive intervention.
Risk quintiles and observed bleeding rates
The total score places the patient into one of five quintiles. The bleeding rates below are the observed rates of in-hospital major bleeding in the derivation cohort of the original study, alongside the number of patients in each quintile. Major bleeding in the CRUSADE definition comprised intracranial haemorrhage, documented retroperitoneal bleeding, a fall in haematocrit of at least 12 percent from baseline to nadir, any red-cell transfusion when the baseline haematocrit was 28 percent or higher, or witnessed bleeding requiring intervention.
| CRUSADE score | Risk category | Observed major bleeding | Patients in derivation cohort |
|---|---|---|---|
| 20 or below | Very low | 3.1% | 19,486 |
| 21 to 30 | Low | 5.5% | 12,545 |
| 31 to 40 | Moderate | 8.6% | 11,530 |
| 41 to 50 | High | 11.9% | 10,961 |
| Above 50 | Very high | 19.5% | 15,210 |
The gradient is steep and clinically meaningful: a patient in the very high risk quintile bled at more than six times the rate of a patient in the very low quintile. The score performed consistently across treatment subgroups in the original analysis, with c-statistics of 0.72 among patients receiving two or more antithrombotics, 0.73 among those receiving fewer than two, 0.73 among those managed with cardiac catheterisation, and 0.68 among those managed conservatively. This consistency is what makes the score useful at presentation, before the treatment strategy is finalised: it quantifies baseline bleeding risk across all post-admission treatments rather than being tied to one particular pathway.
Worked example
Consider a 74-year-old woman presenting with NSTEMI: baseline haematocrit 28 percent (9 points), creatinine clearance 25 mL/min (35 points), heart rate 115 beats per minute (10 points), female sex (8 points), systolic blood pressure 100 mmHg (8 points), and no signs of heart failure, no prior vascular disease, and no diabetes (0 points each). The total is 70 points, placing her in the very high risk quintile, in which 19.5 percent of derivation-cohort patients experienced in-hospital major bleeding. Contrast this with a man with haematocrit 42 percent, creatinine clearance 100 mL/min, heart rate 70, and systolic pressure 130 mmHg, with none of the binary risk factors: his total is 8 points (7 for creatinine clearance plus 1 for blood pressure), placing him in the very low risk quintile with a 3.1 percent observed bleeding rate. The two patients differ by a factor of more than six in observed bleeding risk, yet both carry the same NSTEMI diagnosis, which is precisely the gap the score is designed to expose.
Weighing bleeding risk against ischaemic risk
A high CRUSADE score is not a reason to withhold treatment; it is a reason to treat thoughtfully. Every antithrombotic and invasive strategy in NSTEMI trades ischaemic benefit against bleeding harm, and the score exists so that the bleeding side of that trade can be quantified at the bedside rather than guessed. The original authors explicitly framed the tool this way: patients at high bleeding risk might receive less aggressive anticoagulant and antiplatelet regimens, while those at low bleeding risk could receive full-dose therapy. In practice, bleeding risk must always be weighed against ischaemic risk, and the standard companion on the ischaemic side is the GRACE score, which estimates the risk of death and recurrent ischaemic events. Using the two scores alongside each other gives a balanced picture: a patient with high GRACE ischaemic risk and low CRUSADE bleeding risk is a strong candidate for an early invasive strategy with full antithrombotic therapy, whereas a patient with high bleeding risk and lower ischaemic risk may warrant dose adjustment, careful choice of agents, and attention to modifiable bleeding hazards such as excessive dosing in renal impairment, prolonged dual therapy without indication, and femoral rather than radial arterial access. Because the CRUSADE variables are all available at presentation, the score can inform these decisions before the first heparin bolus is given, which is when bleeding prevention is most effective. It can also be revisited at discharge planning, since patients flagged as high risk merit counselling about bleeding warning signs and closer follow-up of haemoglobin and renal function.
Limitations to keep in mind
The CRUSADE score has genuine limitations that should temper how its number is used. First, it was developed from patients enrolled between 2003 and 2006, an era before the newest potent P2Y12 inhibitors and before radial access became routine, so absolute bleeding rates in contemporary practice may differ even if the risk ranking holds. Second, it uses only baseline variables, which means it cannot capture anything that happens after admission: the choice of antithrombotic agents, their dosing accuracy, access site, procedural complications, and length of stay all influence bleeding but are invisible to the score. Third, a history of prior bleeding or a known bleeding diathesis was not collected in the CRUSADE registry and therefore could not enter the model, even though clinicians rightly weight such a history heavily. Fourth, the derivation excluded patients who died within the first 48 hours and censored bleeding events at the time of coronary artery bypass surgery, which shapes the population the rates apply to. Finally, the discrimination of the score is modest rather than excellent, with a c-statistic of 0.71 in derivation and 0.70 in validation, so it stratifies groups well but cannot predict any single patient's outcome with precision. Used with these caveats, it remains one of the best validated bedside tools for baseline bleeding risk in NSTEMI.