Diamond-Forrester Calculator: Pretest Probability of Coronary Artery Disease
In short: Free Diamond-Forrester calculator: pretest probability of significant coronary artery disease from age, sex and chest pain type, using the classic 1979 table. Educational tool, not medical advice. Use the calculator above, then read the guide below to interpret your result and its limitations.
Estimate the pretest probability of significant coronary artery disease from age, sex and chest pain type, using the classic 1979 Diamond-Forrester table. Three facts in, one probability out, with the standard low, intermediate and high bands.
The calculator
Pretest probability: Not yet calculated
Enter age, sex and chest pain type, then press Calculate.
What pretest probability means
Every cardiac test is interpreted in context, and the context has a number: the probability the patient had significant coronary disease before the test was done. A positive stress test in a 60-year-old man with typical angina means something very different from the same result in a 35-year-old woman with sharp chest wall pain. Pretest probability is what makes that difference explicit. It answers the question "before we test, how likely was disease anyway?", and it decides whether testing is likely to help at all.
The logic comes from Bayes' theorem, though few clinicians reach for the formula at the bedside. A test's result updates the starting probability; when the starting probability is very low, even a positive test is more likely to be a false alarm, and when it is very high, a negative test may not reassure. The patients who gain most from testing are in the middle, where the result can genuinely swing the decision. Diamond and Forrester gave clinicians the first practical way to put a number on the starting point, using just age, sex and the character of the pain.
The three features of chest pain
Diamond's classification rests on three features: the discomfort is substernal in location, it is precipitated by exertion or emotion, and it is relieved by rest or nitrates. Typical angina has all three. Atypical angina has two. Nonanginal chest pain has one or none. This looks almost too simple, but it works because the features track the underlying physiology: exertional, retrosternal pain relieved by rest is what myocardial ischaemia feels like, and each missing feature dilutes the likelihood that the coronary arteries are the culprit.
Getting the classification right matters more than any other step. In the table, moving from typical to atypical angina roughly halves the probability for most age and sex combinations, and moving to nonanginal pain drops it by an order of magnitude. When the history is unclear, the honest move is to classify conservatively and say so, not to force the pain into the typical box because it feels safer.
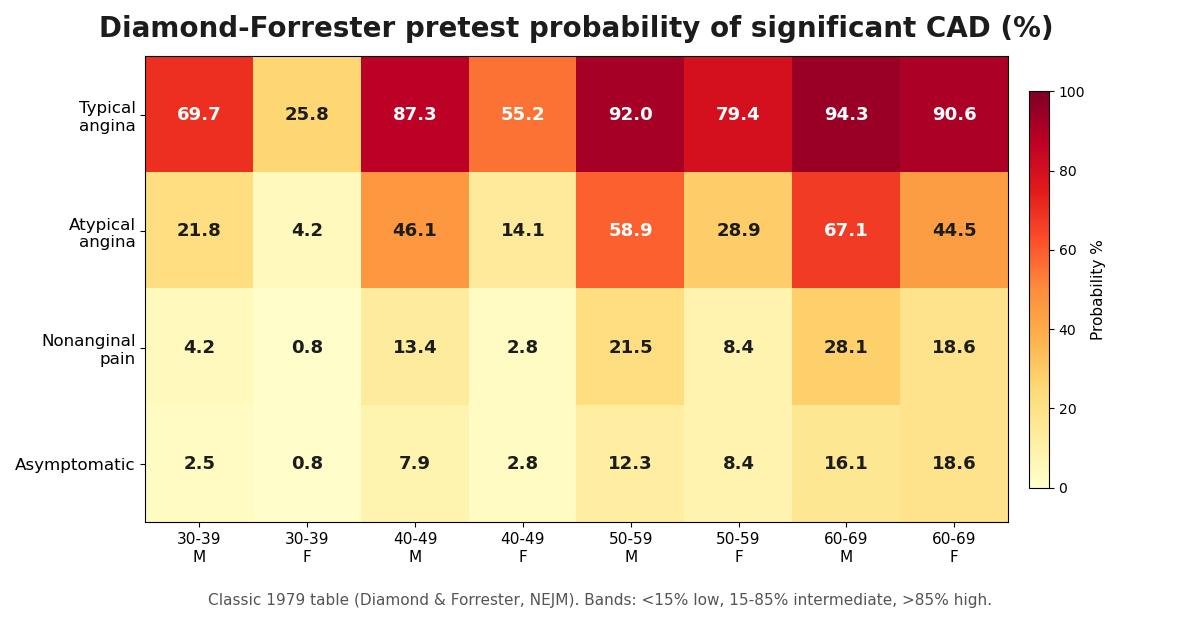
Reading the table
| Age | Typical angina (M / F) | Atypical angina (M / F) | Nonanginal pain (M / F) | Asymptomatic (M / F) |
|---|---|---|---|---|
| 30-39 | 69.7 / 25.8 | 21.8 / 4.2 | 4.2 / 0.8 | 2.5 / 0.8 |
| 40-49 | 87.3 / 55.2 | 46.1 / 14.1 | 13.4 / 2.8 | 7.9 / 2.8 |
| 50-59 | 92.0 / 79.4 | 58.9 / 28.9 | 21.5 / 8.4 | 12.3 / 8.4 |
| 60-69 | 94.3 / 90.6 | 67.1 / 44.5 | 28.1 / 18.6 | 16.1 / 18.6 |
All values are percentages. Three patterns deserve attention. First, sex matters enormously at younger ages and converges later: a 35-year-old man with typical angina sits near 70 percent while a woman the same age sits near 26. Second, typical angina in anyone over 50 is high probability almost regardless of sex, which is why such patients often move toward definitive assessment. Third, asymptomatic people have low probabilities throughout, which is the quantitative backbone of the teaching that screening asymptomatic low-risk adults with cardiac testing does more harm than good.
What the bands guide
The commonly applied bands are below 15 percent (low), 15 to 85 percent (intermediate) and above 85 percent (high). Low-probability patients generally need no cardiac testing; the yield is tiny and false positives dominate. Intermediate-probability patients are where testing earns its keep, with the choice of test depending on local availability, the ECG, and whether the patient can exercise. High-probability patients may go directly toward invasive angiography, particularly when symptoms are typical and the ECG is abnormal. These thresholds come from chronic coronary disease guidance, not from the 1979 paper, and different guidelines draw the lines in slightly different places.
Worked examples
Example 1. A 55-year-old man with typical angina: age band 50-59, male, typical gives 92.0 percent, high pretest probability. Testing here refines rather than decides; the clinical question is usually about anatomy and revascularisation rather than whether disease exists.
Example 2. A 45-year-old woman with atypical angina: 40-49, female, atypical gives 14.1 percent, just inside the low band. A normal ECG and no risk factors would reasonably end the cardiac workup here, with attention turned to other causes of the pain.
Example 3. A 62-year-old man with nonanginal chest pain: 60-69, male, nonanginal gives 28.1 percent, intermediate. This is the sweet spot for testing: the result will genuinely move the needle, so a functional test or anatomical imaging is well justified.
Why the starting probability matters more than the test
It is worth pausing on why Diamond and Forrester bothered, because the intuition runs against the grain. Most people assume a good test settles the question. Suppose a stress test is 80 percent sensitive and 80 percent specific, respectable numbers. Run it on 1,000 people whose pretest probability is 50 percent: 500 truly have disease, the test catches 400 and misses 100; 500 do not, the test wrongly flags 100. A positive result then means 400 true positives out of 500 positives, an 80 percent post-test probability. Useful.
Now run the same test on 1,000 people with a 2 percent pretest probability, the asymptomatic low-risk crowd. Twenty truly have disease; the test catches 16. Of the 980 without disease, the test wrongly flags 196. A positive result now means 16 true positives out of 212 positives: under 8 percent. The test is identical, the patient is different, and the positive result went from decisive to nearly meaningless. This is not a flaw in the test; it is arithmetic. It is also why guidelines discourage testing low-probability patients: you mostly manufacture anxiety, downstream procedures, and harm.
The mirror image matters too. Take a 60-year-old man with typical angina at 94 percent pretest probability. A negative stress test barely dents that number, because the test misses enough disease that a negative result in this population is often a false negative. High-probability patients are frequently better served by going straight to anatomical assessment than by a functional test whose negative result nobody will believe. The calculator's three bands encode exactly this reasoning: test the middle, spare the low, and do not let a reassuring test overrule a high starting probability.
Limitations worth knowing
The 1979 table overestimates probability in contemporary practice. Coronary disease prevalence has fallen, referral patterns have changed, and the angiography series Diamond and Forrester pooled were subject to verification bias, since only referred patients were catheterised. The updated Diamond-Forrester model of 2011, refitted by Genders and colleagues on over 2,200 patients, typically returns lower numbers for the same inputs and adds predictors. The table also knows nothing about diabetes, smoking, lipids, family history or the ECG, all of which modify risk substantially. Use it as the starting point it was designed to be, then let the rest of the clinical picture move the number.
Key takeaways
- The Diamond-Forrester model estimates the pretest probability that a patient has significant coronary artery disease, meaning a major coronary narrowing, based on three simple facts: age, sex and the type of chest pain.
- Diamond defined three features: the pain is substernal in location, it is precipitated by exertion or emotion, and it is relieved by rest or nitrates.
- The commonly applied bands are below 15 percent (low), 15 to 85 percent (intermediate) and above 85 percent (high).
- The original Diamond-Forrester table covers ages 30 to 69 in decade bands, and this calculator does not extrapolate beyond them.