SCORE2 10-Year Cardiovascular Risk Calculator
Estimate your 10-year risk of fatal and non-fatal cardiovascular disease using the ESC 2021 SCORE2 model, calibrated for the low-risk region of Europe (Denmark).
In short: Estimate your 10-year risk of fatal and non-fatal cardiovascular disease using the ESC 2021 SCORE2 model, calibrated for the low-risk region of Europe (Denmark). Use the calculator above, then read the guide below to interpret your result and its limitations.
Calculate your SCORE2 risk
What is the SCORE2 calculator?
SCORE2 stands for Systematic COronary Risk Evaluation 2. It is the cardiovascular risk prediction model recommended by the 2021 European Society of Cardiology (ESC) guidelines on cardiovascular disease prevention in clinical practice. It replaced the original SCORE model, which had been in use since 2003, because the older model only predicted the 10-year risk of dying from cardiovascular disease, while modern prevention needs to account for non-fatal events too. SCORE2 was derived from individual participant data from 45 prospective cohorts in 13 European countries, covering 677,684 people and 30,121 first cardiovascular events, and it was externally validated in 25 further cohorts with more than 1.1 million individuals.
The model uses six inputs: age, sex, current smoking status, systolic blood pressure, total cholesterol, and HDL cholesterol. These are the classic, routinely measured risk factors that carry most of the predictive information for a first cardiovascular event. Notably, SCORE2 does not ask for diastolic blood pressure, LDL cholesterol, body mass index, or family history. This was a deliberate choice by the developers: the included factors are measured in almost every primary care setting in Europe, which keeps the tool practical for everyday consultations.
What SCORE2 estimates
SCORE2 estimates your 10-year risk of a first fatal or non-fatal cardiovascular disease event. In plain language, it answers the question: out of 100 people with exactly your age, sex, smoking status, blood pressure, and cholesterol levels, how many would be expected to have a heart attack, a stroke, or another major atherosclerotic cardiovascular event, or to die from cardiovascular disease, within the next 10 years? A result of 6 percent therefore means roughly 6 out of 100 similar people would experience such an event in the coming decade, while 94 would not.
Including non-fatal events matters. The original SCORE model predicted only cardiovascular death, which understated the total burden of disease, especially in younger people and in women, where non-fatal events make up a large share of first presentations. By estimating the combined endpoint of fatal and non-fatal cardiovascular disease, SCORE2 better reflects what patients and clinicians actually want to prevent. The model also adjusts for competing risks, which means it accounts for the possibility of dying from something other than cardiovascular disease during the 10-year window, so the percentages are not inflated.
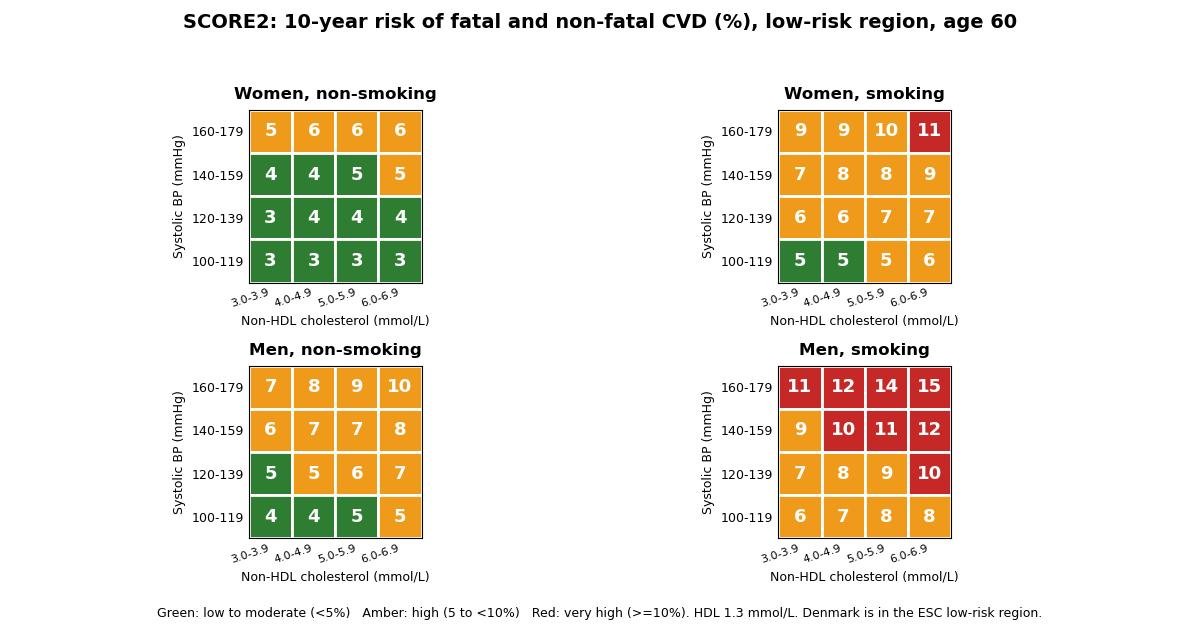
SCORE2 is calibrated for European populations. Cardiovascular disease rates differ substantially across Europe, following a well documented west to east and north to south gradient. To handle this, the ESC recalibrated the SCORE2 equations separately for four European risk regions: low, moderate, high, and very high cardiovascular mortality. Denmark is in the low-risk region, together with countries such as Norway and Sweden. This calculator uses the low-risk region recalibration, so the percentages it produces are the ones appropriate for people living in Denmark. Someone with identical risk factors in a very high-risk region would receive a markedly higher estimate, which is why using the correct region is essential.
Your inputs explained
Age (40 to 69 years). Age is the strongest single predictor in the model. SCORE2 is validated only for ages 40 to 69. Below 40, absolute 10-year risk is so low that the model adds little, and from 70 onward the dedicated SCORE2-OP model takes over. If you enter an age outside 40 to 69, this calculator refuses to compute a result rather than extrapolating beyond the validated range.
Sex. SCORE2 uses separate equations for men and women, because both baseline risk and the strength of individual risk factors differ by sex. At the same age and risk factor levels, men generally have a higher estimated 10-year risk than women.
Current smoking. Smoking status is recorded as current smoker versus not currently smoking. Current smoking roughly doubles cardiovascular risk in the model, and its effect interacts with age: the relative effect of smoking is somewhat larger at younger ages. Former smokers are counted as non-smokers for the calculation, which is one more reason to quit.
Systolic blood pressure. Enter the higher number from your blood pressure reading, in mmHg. Ideally this should be the average of several measurements taken at rest, since a single reading can be misleadingly high or low. The model accepts values between 100 and 200 mmHg.
Total cholesterol and HDL cholesterol. These can be entered in mmol/L, the unit used in Denmark, or in mg/dL. Total cholesterol reflects the overall cholesterol burden, while HDL cholesterol, often called the protective cholesterol, lowers the estimated risk. The model uses both together rather than non-HDL cholesterol, though the two approaches carry similar information. Physiologically, HDL cannot exceed total cholesterol, and the calculator checks this.
How to read your result
Your result is a percentage with an ESC risk category. The 2021 ESC guidelines define the categories differently by age, because absolute risk rises steeply as people get older. Using the same percentage cut-off at every age would label almost every 65-year-old as high risk and almost no 45-year-old, which would not help clinicians prioritise treatment sensibly.
| Age group | Low to moderate risk | High risk | Very high risk |
|---|---|---|---|
| Under 50 years | Under 2.5% | 2.5% to under 7.5% | 7.5% or higher |
| 50 to 69 years | Under 5% | 5% to under 10% | 10% or higher |
A low to moderate result does not mean zero risk, and it does not mean risk factors should be ignored: the guidelines still recommend a healthy lifestyle for everyone, including not smoking, regular physical activity, and a healthy diet. A high or very high result means your clinician will usually discuss more intensive prevention with you. This often includes a conversation about statin therapy and blood pressure treatment, weighed against your preferences, bleeding risk, frailty, and other individual circumstances. The percentage is a starting point for shared decision making, not a treatment order.
Who should not use SCORE2
SCORE2 was derived in people without prior cardiovascular disease and without diabetes, and it is only validated for apparently healthy individuals. It does not apply to people with established atherosclerotic cardiovascular disease, such as a previous heart attack, stroke, coronary stent, bypass surgery, or peripheral artery disease. These patients are already at very high risk by definition, and their management follows secondary prevention guidelines rather than a risk score.
People with diabetes should not use SCORE2 either. Diabetes alters cardiovascular risk through mechanisms the SCORE2 equations do not capture, and the ESC classifies most people with diabetes as already at high or very high risk. The dedicated SCORE2-Diabetes tool, published in 2023, is the appropriate model for people with type 2 diabetes aged 40 to 69, because it adds diabetes-specific predictors: glycated haemoglobin (HbA1c), kidney function (eGFR), and age at diabetes diagnosis.
Two further groups fall outside the scope of SCORE2. People with chronic kidney disease, particularly moderate to severe disease, carry a substantially elevated cardiovascular risk that the model does not account for, and the guidelines place them directly into high or very high risk categories. People with familial hypercholesterolaemia, the inherited condition causing very high LDL cholesterol from a young age, are likewise considered high risk and need specialist assessment rather than a population risk equation. If any of these apply to you, tick the relevant box above and the calculator will explain this instead of producing a misleading number.
Finally, SCORE2 does not cover ages 70 and above. For older adults, the ESC developed SCORE2-OP (SCORE2 for Older Persons), which estimates both 5-year and 10-year risk of fatal and non-fatal cardiovascular disease. SCORE2-OP accounts for the much larger role of competing non-cardiovascular mortality at older ages, something a simple extrapolation of SCORE2 would get wrong. Together, SCORE2, SCORE2-OP, and SCORE2-Diabetes form a family of tools that covers the adult population across the relevant clinical situations.
How the risk is calculated
Under the surface, SCORE2 is a sex-specific Cox proportional hazards model with adjustment for competing risks. Each risk factor is first centred and scaled: for example, age is expressed as (age minus 60) divided by 5, and systolic blood pressure as (SBP minus 120) divided by 20. The model then combines the risk factors into a single prognostic index using the published coefficients, including interaction terms between each risk factor and age, which capture the fact that the relative importance of risk factors changes as people get older.
The prognostic index is converted to an uncalibrated 10-year risk using the baseline survival of the derivation population, and then recalibrated to the low-risk region of Europe using region-specific parameters. This two-step recalibration is what makes a Danish estimate different from an estimate for the same person in a high-risk region: the relative effects of the risk factors are the same everywhere, but the absolute baseline risk is scaled to the cardiovascular mortality and incidence of each region. The exact coefficients, baseline survival values, and recalibration parameters used by this calculator are the published values from the SCORE2 paper and its appendix, and the implementation reproduces the worked examples published in the paper, including 5.9 percent for a 50-year-old male smoker and 4.2 percent for a 50-year-old female smoker with otherwise identical risk factors in the low-risk region.
Limitations
No risk model captures everything. SCORE2 does not consider family history of premature cardiovascular disease, socioeconomic deprivation, chronic inflammatory conditions such as rheumatoid arthritis, severe mental illness, or ethnicity, all of which can modify risk. These are sometimes called risk modifiers, and the ESC guidelines advise clinicians to consider them alongside the calculated percentage, particularly when the result falls near a category threshold.
The model also assumes that a single set of measurements represents your usual levels. Blood pressure and cholesterol fluctuate, and treatment changes them. SCORE2 estimates the risk associated with your current untreated risk factor levels; it is not designed to predict how much your risk would fall with a specific treatment, although separate treatment-benefit tools exist for that purpose. The equations reflect European cohort data, mostly from the past few decades, and risk factor distributions and treatments have shifted since some of the derivation cohorts were recruited. Finally, a risk percentage describes groups, not individuals: it cannot say whether you personally will or will not have an event.
Lowering your cardiovascular risk
Whatever your SCORE2 result, the foundations of prevention are the same. Not smoking is the single most powerful change: within a few years of quitting, cardiovascular risk falls substantially, which is one reason the model treats former smokers as non-smokers. Regular moderate physical activity, at least 150 minutes per week, a Mediterranean-style dietary pattern rich in vegetables, fruit, whole grains, and unsaturated fats, maintaining a healthy weight, and limiting alcohol all contribute.
Blood pressure and cholesterol deserve attention even when you feel well, because they cause no symptoms while quietly damaging arteries. If your result is in the high or very high category, your clinician may recommend medication in addition to lifestyle changes. Statins lower LDL cholesterol and cardiovascular events with a well characterised safety profile, and blood pressure lowering reduces stroke and heart failure risk. These decisions are individual: the SCORE2 percentage informs the discussion, and your preferences, other conditions, and potential side effects shape the final plan. Repeating the calculation after sustained lifestyle change or treatment can illustrate how your estimated risk has moved, though the model should be applied to current measurements each time.
Key takeaways
- SCORE2 estimates your 10-year risk of a first fatal or non-fatal cardiovascular event, such as a heart attack or stroke.
- SCORE2 is validated for apparently healthy adults aged 40 to 69 years.
- Denmark is in the ESC low-risk region for cardiovascular mortality, together with countries such as Norway and Sweden.
- SCORE2 was derived in people without diabetes, and diabetes changes cardiovascular risk in ways the SCORE2 equations do not capture.
Frequently asked questions
What does the SCORE2 calculator estimate?
SCORE2 estimates your 10-year risk of a first fatal or non-fatal cardiovascular event, such as a heart attack or stroke. It is expressed as a percentage: for example, a result of 6 percent means that about 6 out of 100 people with your risk profile would be expected to have a cardiovascular event within 10 years.
What is the valid age range for SCORE2?
SCORE2 is validated for apparently healthy adults aged 40 to 69 years. It does not apply below age 40 or from age 70 onward. If you are 70 or older, the related SCORE2-OP tool is the appropriate model, because competing risks from non-cardiovascular causes of death become much more important at older ages.
Which ESC risk region does Denmark belong to?
Denmark is in the ESC low-risk region for cardiovascular mortality, together with countries such as Norway and Sweden. This calculator uses the SCORE2 model recalibrated for the low-risk region, so the percentages it produces are the ones appropriate for people living in Denmark.
Why can I not use SCORE2 if I have diabetes?
SCORE2 was derived in people without diabetes, and diabetes changes cardiovascular risk in ways the SCORE2 equations do not capture. People with diabetes are already considered at high or very high cardiovascular risk by the ESC guidelines, and the dedicated SCORE2-Diabetes tool should be used instead, because it adds diabetes-specific predictors such as HbA1c, kidney function, and age at diabetes diagnosis.
What do the SCORE2 risk categories mean?
For ages under 50, under 2.5 percent is low to moderate risk, 2.5 to under 7.5 percent is high risk, and 7.5 percent or more is very high risk. For ages 50 to 69, under 5 percent is low to moderate risk, 5 to under 10 percent is high risk, and 10 percent or more is very high risk. The thresholds are higher at older ages because absolute cardiovascular risk rises steeply with age.
What is the difference between SCORE2, SCORE2-OP, and SCORE2-Diabetes?
SCORE2 is for apparently healthy adults aged 40 to 69. SCORE2-OP is the older-persons version for ages 70 and above, and it estimates both 5-year and 10-year risk while accounting for competing non-cardiovascular mortality. SCORE2-Diabetes is for people with type 2 diabetes aged 40 to 69 and adds diabetes-related predictors. All three were developed by the same ESC working groups and use the same four European risk regions.
References
- SCORE2 working group and ESC Cardiovascular risk collaboration. SCORE2 risk prediction algorithms: new models to estimate 10-year risk of cardiovascular disease in Europe. Eur Heart J. 2021;42(25):2439-2454.
- Visseren FLJ, Mach F, Smulders YM, et al. 2021 ESC Guidelines on cardiovascular disease prevention in clinical practice. Eur Heart J. 2021;42(34):3227-3337.
- SCORE2-OP working group and ESC Cardiovascular risk collaboration. SCORE2-OP risk prediction algorithms: estimating incident cardiovascular event risk in older persons in four geographical risk regions. Eur Heart J. 2021;42(25):2455-2467.
- SCORE2-Diabetes Working Group and the ESC Cardiovascular Risk Collaboration. SCORE2-Diabetes: 10-year cardiovascular risk estimation in type 2 diabetes in Europe. Eur Heart J. 2023;44(28):2544-2556.
- Evidencio. User manual: SCORE2 medical device software, version 5. Documents the SCORE2 input ranges, the four European risk regions with country lists, and the age-dependent risk categories of the 2021 ESC guidelines.
- ESC Clinical Practice Guidelines
- American College of Cardiology