Breast Cancer Risk Models: Gail-Style 5-Year and Lifetime Risk Calculator
Enter the seven classic Gail model inputs to estimate your absolute 5-year and lifetime (to age 90) risk of invasive breast cancer, see how you compare with the average woman your age, and learn which guideline thresholds your numbers cross.
In short: Enter the seven classic Gail model inputs to estimate your absolute 5-year and lifetime (to age 90) risk of invasive breast cancer, see how you compare with the average woman your age, and learn which guideline thresholds your numbers cross. Use the calculator above, then read the guide below to interpret your result and its limitations.
The calculator
What this calculator does, and what it is not
Breast cancer risk models answer a deceptively simple question: out of 100 women exactly like you, how many will develop invasive breast cancer in the next 5 years, and how many before age 90? The answer matters because several important decisions hinge on it. At a 5-year risk of 1.67% or higher, US guidelines advise discussing risk-reducing medication. At a lifetime risk of 20% or higher, guidelines advise adding annual breast MRI to mammography. Without a number, those decisions are guesswork; with one, they become structured.
This calculator implements the logic of the most famous such model, the Gail model, in a transparent simplified form. You give it seven inputs, it multiplies their relative risks together, applies the product to age-specific baseline incidence rates for your racial and ethnic group, and converts the result into absolute probabilities over 5 years and over your remaining lifetime to age 90. It also shows the same two probabilities for an average woman of your age and background, so you can see the comparison directly. Every number on this page comes from published sources, and the method is documented below so you can check the arithmetic.
What it is not: it is not the official NCI Breast Cancer Risk Assessment Tool at bcr.cancer.gov, which uses the full Gail model with its exact baseline hazard tables and competing-mortality adjustments. It does not know about BRCA1 or BRCA2 mutations, ovarian cancer in the family, male breast cancer, second-degree relatives, hormone therapy, body weight, breast density, or polygenic risk scores, all of which the newer Tyrer-Cuzick model handles. If any of those apply to you, the number here is at best a lower bound, and you should use the official tool or see a genetic counselor.
The Gail model: a 1989 breakthrough
In 1989, the biostatistician Mitchell Gail and colleagues published "Projecting individualized probabilities of developing breast cancer for white females who are being examined annually" in the Journal of the National Cancer Institute (1989;81:1879-1886). Their data came from the Breast Cancer Detection Demonstration Project, a huge 1970s screening program that had followed hundreds of thousands of women, nested with a case-control study comparing women who developed breast cancer with women who did not. From that study they extracted the relative risks of a handful of factors a clinician could ask about in a minute: when periods started, when the first child was born, how many close relatives had breast cancer, and how many biopsies the woman had undergone.
The model's cleverness was not the list but the conversion. Relative risks say how much more likely cancer is, but women need absolute probabilities, and absolute probabilities need a baseline: how often breast cancer strikes women of each age in the first place. Gail combined the relative risks with age-specific incidence rates from US cancer registries, producing for the first time a personalized number like "your chance in the next 5 years is 2.1%." The model was validated in independent populations, including the Nurses' Health Study (Rockhill and colleagues, JNCI 2001;93:358-366), which found its predictions reasonably calibrated for groups of women, though imperfect for individuals, the standard caveat of every risk model ever built.
In 1999, Costantino and colleagues published an update (JNCI 1999;91:1541-1548) that extended the model beyond white women with race- and ethnicity-specific relative risks and baseline rates, and the National Cancer Institute built the result into the Breast Cancer Risk Assessment Tool, the BCRAT, which remains the standard implementation clinicians use. The 1999 paper also confirmed the model's most important practical property: it identifies, with reasonable accuracy, the women whose 5-year risk reaches the 1.67% line that the tamoxifen prevention trial had used for eligibility.
How the numbers on this page are built
The calculation has three ingredients. First, a baseline: the approximate annual incidence of invasive breast cancer per 100,000 women at each age, drawn from US SEER registry patterns as summarized by the American Cancer Society. The rates rise steeply with age, which is why age dominates every risk estimate:
| Age band | 35-39 | 40-44 | 45-49 | 50-54 | 55-59 | 60-64 | 65-69 | 70-74 | 75-79 | 80-84 | 85-89 |
|---|---|---|---|---|---|---|---|---|---|---|---|
| Cases per 100,000 per year (approx.) | 60 | 122 | 189 | 228 | 271 | 341 | 396 | 425 | 443 | 435 | 392 |
Second, a race and ethnicity adjustment to that baseline, because incidence differs across groups. Relative to white women (1.00), the approximate multipliers used here are 0.95 for Black or African American women, 0.78 for Asian or Pacific Islander women, 0.74 for Hispanic or Latina women, and 0.72 for American Indian or Alaska Native women, reflecting American Cancer Society incidence summaries for 2015 to 2019. Incidence is not the whole story across groups, Black women face higher breast cancer mortality despite slightly lower incidence, a disparity the model does not capture, which is worth stating plainly.
Third, the personal relative risks, the published Gail model values (Gail 1989; Costantino 1999), multiplied together into one composite relative risk:
| Risk factor | Your answer | Relative risk |
|---|---|---|
| Age at menarche | 14 or older / 12-13 / younger than 12 | 1.00 / 1.10 / 1.21 |
| Age at first live birth | Younger than 20 / 20-24 / 25-29 or nulliparous / 30 or older | 1.00 / 1.24 / 1.55 / 1.93 |
| First-degree relatives with breast cancer | None / one / two or more | 1.00 / 2.61 / 6.80 |
| Breast biopsies, age under 50 | None / one / two or more | 1.00 / 1.70 / 2.88 |
| Breast biopsies, age 50 or older | None / one / two or more | 1.00 / 1.27 / 1.62 |
| Atypical hyperplasia on any biopsy | Yes | Doubles the biopsy term (see text) |
A word on the atypical hyperplasia line, since it is the one place this page simplifies rather than transcribes. In the full BCRAT, hyperplasia interacts with the biopsy count through the model's fitted interaction terms. Here, a "yes" multiplies the biopsy relative risk by 2.0, a documented simplification grounded in the classic pathology literature: Dupont and Page (New England Journal of Medicine 1985;312:146-151) found atypical hyperplasia carried roughly 4.4 times the population risk, and Hartmann and colleagues (NEJM 2005;353:229-237) found an absolute risk near 29% at 25 years of follow-up. A multiplier of 2.0 on top of the biopsy terms (1.70 or 2.88) lands squarely in that published range.
Finally, the composite relative risk scales each year's baseline rate, and the absolute probability over any span is one minus the product of the yearly survival probabilities: risk = 1 - (1 - h1) x (1 - h2) x ... where each year's hazard h is the baseline rate times the race multiplier times your composite relative risk. Five-year risk sums the next 5 years; lifetime risk sums every year from your current age to 90. The same arithmetic with a composite relative risk of 1.00 gives the average-woman comparison shown beside your result.
The Tyrer-Cuzick model, and when it is the better choice
The Gail model has a famous blind spot: family history. It counts only first-degree relatives with breast cancer and knows nothing about the age they were diagnosed, second-degree relatives, ovarian cancer in the family, breast cancer in men, or BRCA1 and BRCA2 mutations. In a woman from a strongly affected family, the Gail estimate can be less than half the true risk, which is why guidelines do not rely on it there.
The Tyrer-Cuzick model, published by Tyrer, Duffy, and Cuzick in Statistics in Medicine (2004;23:1111-1130) and widely known as the IBIS tool after the International Breast Intervention Study, was built to fill exactly that gap. It takes a detailed pedigree, ages at diagnosis, ovarian and male breast cancers, and known gene mutations, and adds hormonal and lifestyle factors the Gail model ignores: hormone therapy use, body mass index, age at menopause, and in version 8 (released 2017) mammographic density, with polygenic risk scores incorporated in the most recent implementations. It was validated in a UK cohort by Amir and colleagues (British Journal of Cancer 2010;102:111-114), who found it well calibrated for the high-risk women it was designed for.
The practical rule is simple. If your family history is limited to zero or one first-degree relative and no known mutation, the Gail-style number on this page is a reasonable estimate. If you have two or more affected relatives, any ovarian cancer in the family, breast cancer diagnosed young, male breast cancer, Ashkenazi Jewish ancestry with breast or ovarian cancer, or a known BRCA mutation, use the Tyrer-Cuzick (IBIS) tool or see a genetic counselor instead, and treat the number from this page as a floor, not a ceiling. The NCCN Genetic/Familial High-Risk Assessment guideline lists the formal referral criteria.
The two thresholds that change management
Risk numbers earn their keep at two cutoffs. The first is a 5-year risk of 1.67%. That figure is not arbitrary: it was the eligibility threshold of the NSABP P-1 Breast Cancer Prevention Trial, reported by Fisher and colleagues (JNCI 1998;90:1371-1388), in which five years of tamoxifen reduced the incidence of invasive breast cancer by 49% in high-risk women. The STAR trial (Vogel and colleagues, JAMA 2006;295:2727-2741) later showed raloxifene worked about as well as tamoxifen in postmenopausal women with a different side-effect profile. On that evidence, the NCCN Breast Cancer Risk Reduction guideline advises that women with a 5-year risk of 1.67% or higher, or a history of lobular carcinoma in situ, be counseled about endocrine risk-reducing therapy: tamoxifen, raloxifene, or an aromatase inhibitor. This calculator flags your result against that line.
The second is a lifetime risk of 20%. At or above 20%, the NCCN Breast Cancer Screening and Diagnosis guideline recommends annual breast MRI in addition to mammography, because MRI finds cancers mammography misses in high-risk breasts, and finding them earlier means more curable disease. Surveillance does not prevent cancer; it shifts diagnosis earlier, which is its own kind of prevention of the worst outcomes. This calculator flags that line too.
For perspective on where these cutoffs sit: an average 50-year-old white woman has a 5-year risk around 1.1%, below the medication line, and a lifetime risk to 90 around 12 to 13%, below the MRI line, consistent with the American Cancer Society's headline figure that about 1 in 8 women (roughly 13%) develop invasive breast cancer in their lifetime. The thresholds are set so that only meaningfully elevated risk triggers the extra interventions, each of which carries its own burdens: endocrine therapy has side effects, and MRI brings false alarms and cost.
What the model cannot see
Every model is a simplification, and honesty about the simplifications is part of using one well. This page's model ignores competing mortality: it computes the chance of breast cancer as if nothing else could intervene, which slightly overstates lifetime risk at older ages, where other causes of death compete. It treats relative risks as fixed multipliers independent of each other, which the real biology is not. It knows nothing about breast density, one of the strongest risk factors and the reason several US states now mandate density notification after mammography. It knows nothing about alcohol intake, postmenopausal weight, or physical activity, all established modifiers. And its race adjustments capture average incidence differences while saying nothing about the outcome disparities that matter most.
Two limitations deserve emphasis because they change what you should do. First, as noted above, strong family history breaks this model downward: it will reassure when it should alarm, which is why the Tyrer-Cuzick tool exists. Second, the model was built on data from women undergoing regular screening in the United States, and its calibration elsewhere is less certain. A risk estimate is a property of a group of women like you, not a verdict on you. Roughly 85% of breast cancers occur in women with no family history of the disease, a reminder that "average risk" is not "no risk," and that the standard screening schedule applies to everyone.
What to do with your result
If both numbers sit below the thresholds, the standard advice applies: follow the American Cancer Society screening schedule, annual mammography starting at 45 with the option to begin at 40 (Oeffinger and colleagues, JAMA 2015;314:1599-1614), know how your breasts normally look and feel, and keep the modifiable factors on your side. None of that changes because a calculator printed a low number; it is the baseline every woman deserves.
If your 5-year risk reaches 1.67%, bring the number to your clinician and ask specifically about the endocrine therapy discussion the NCCN guideline describes. The conversation covers benefits (roughly halving the chance of invasive cancer while on treatment), harms (blood clots and uterine effects with tamoxifen, clots and cataracts with raloxifene, bone and joint effects with aromatase inhibitors), and your personal tolerance for each. It is a preference-sensitive decision, which is precisely why the guideline asks for counseling rather than prescribing.
If your lifetime risk reaches 20%, ask about adding annual breast MRI to your surveillance, and ask whether a genetics referral is warranted, since reaching 20% on a Gail-style model often means the fuller Tyrer-Cuzick assessment would go higher. And if anything in your history suggests a hereditary syndrome, early-onset cancers, ovarian cancer, male breast cancer, or known familial mutation, skip the models and seek genetic counseling directly: risk models estimate, but genetic testing can actually answer.
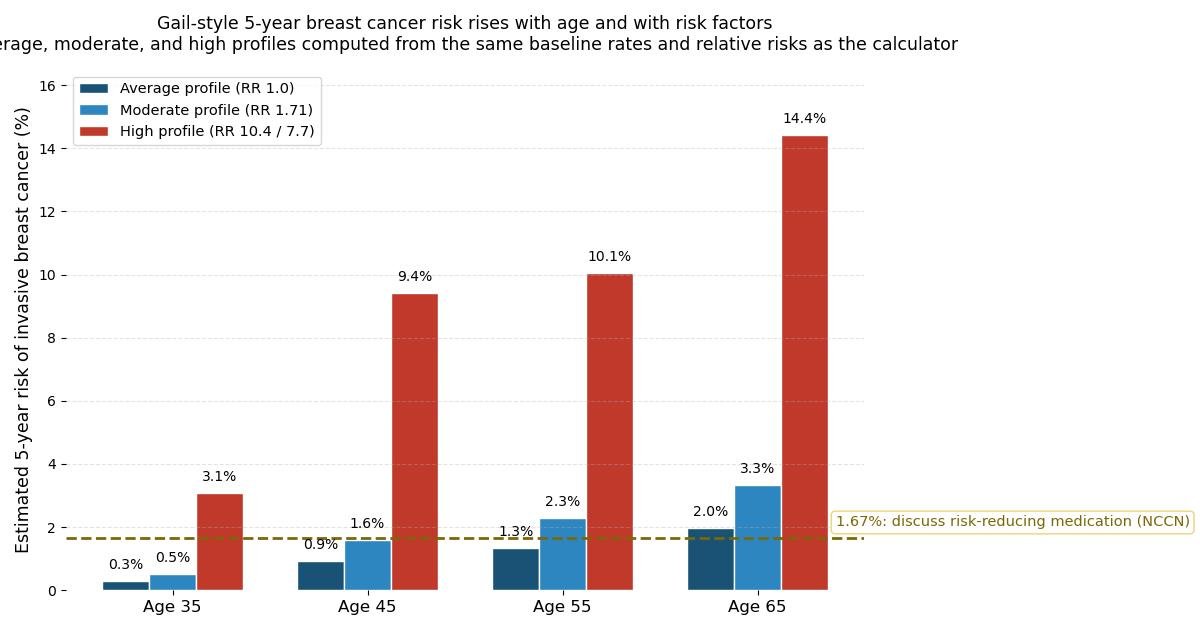
Figure: how 5-year risk climbs with age for three Gail-style risk profiles. The average profile (composite relative risk 1.0) crosses the 1.67% discussion threshold only after about age 60, while the high profile (early menarche, late first birth, one affected relative, one biopsy after 50) sits above it from age 45 onward. All values are computed from the same baseline rates and relative risks documented above.
Key takeaways
- The Gail model, published by Mitchell Gail and colleagues in the Journal of the National Cancer Institute in 1989, projects an individual woman's absolute probability of developing invasive breast cancer over the next 5 years and over her remaining lifetime to age 90.
- A 5-year risk of 1.67% or higher is the threshold used by US guidelines to identify women who should discuss risk-reducing endocrine therapy.
- The Tyrer-Cuzick model (also called the IBIS tool, published in Statistics in Medicine in 2004) asks for much more family detail than the Gail model: second-degree relatives, ovarian cancer in the family, male breast cancer, ages at diagnosis, plus BRCA1 and BRCA2 status, hormone therapy use, body mass index, and, in version 8, mammographic density.
- The Gail model was developed and validated only for women aged 35 and older: there were too few breast cancers under 35 in its source data to estimate risk there reliably.
Frequently asked questions
What is the Gail model for breast cancer risk?
The Gail model, published by Mitchell Gail and colleagues in the Journal of the National Cancer Institute in 1989, projects an individual woman's absolute probability of developing invasive breast cancer over the next 5 years and over her remaining lifetime to age 90. It combines age-specific baseline incidence rates with relative risks from seven inputs: current age, race and ethnicity, age at menarche, age at first live birth, number of first-degree relatives with breast cancer, number of breast biopsies, and whether a biopsy ever showed atypical hyperplasia. The US National Cancer Institute implements it as the Breast Cancer Risk Assessment Tool (BCRAT).
What does a 5-year risk of 1.67% mean?
A 5-year risk of 1.67% or higher is the threshold at which US guidelines advise discussing risk-reducing endocrine therapy. It comes from the NSABP P-1 prevention trial, whose participants met this risk level and in whom tamoxifen cut invasive breast cancer by 49%. The NCCN guideline advises counseling about tamoxifen, raloxifene, or an aromatase inhibitor at or above this line. Reaching it triggers a conversation, not a prescription.
How is the Tyrer-Cuzick model different from the Gail model?
Tyrer-Cuzick (the IBIS tool, 2004) takes a full family pedigree including second-degree relatives, ovarian and male breast cancers, ages at diagnosis, and BRCA status, plus hormone therapy, body mass index, and (in version 8) mammographic density. The Gail model counts only first-degree relatives and knows nothing about genes, so it underestimates risk in strongly affected families. With extensive or early-onset family history, prefer Tyrer-Cuzick or genetic counseling.
Why does this calculator only accept ages 35 to 90?
The Gail model was developed and validated only for women 35 and older; its source data contained too few cancers under 35 to estimate risk there. Breast cancer is rare before 35, and the model cannot be safely extrapolated downward. Lifetime risk is defined to age 90, the model's upper bound. Younger women with concerning family history should seek genetic counseling rather than a population model.
Does a high estimated risk mean I will get breast cancer?
No. A risk estimate is a probability across a group like you, not a personal prediction. Even at 20% lifetime risk, four out of five such women never develop breast cancer, and roughly 85% of all breast cancers occur in women with no family history. The number is useful because it sorts women into action bands (standard screening, MRI surveillance, or a chemoprevention discussion), not because it foretells anyone's future.
What actually lowers breast cancer risk?
For elevated-risk women, the trial-backed options are endocrine risk-reducing therapy (tamoxifen, raloxifene, or an aromatase inhibitor) and, at the highest risk, risk-reducing mastectomy after specialist counseling. For everyone, the American Cancer Society notes that healthy postmenopausal weight, regular physical activity, and limited alcohol are associated with lower risk. Annual MRI for lifetime risk of 20% or more does not prevent cancer but catches it earlier, when it is more curable.