LH/FSH Ratio Calculator: PCOS Workup Aid
In short: Calculate the LH to FSH ratio from early follicular phase labs: enter LH, FSH, and cycle day to get the ratio, interpretation band, day-3 FSH ovarian reserve note, and Rotterdam criteria framing for a PCOS workup. Use the calculator above, then read the guide below to interpret your result and its limitations.
Enter your early follicular phase LH and FSH blood results to compute the LH to FSH ratio. This tool reports the ratio, an interpretation band, a day-3 FSH ovarian reserve note, and Rotterdam criteria context to support a polycystic ovary syndrome (PCOS) workup. It does not diagnose PCOS.
The Calculator
What the LH to FSH ratio measures
Luteinizing hormone (LH) and follicle-stimulating hormone (FSH) are gonadotropins released by the pituitary gland in pulses. Together they drive the menstrual cycle: FSH recruits and grows ovarian follicles, while LH triggers ovulation once a follicle is mature. The LH to FSH ratio is simply the LH value divided by the FSH value, both measured from the same blood draw. Because both hormones are reported in the same units, typically mIU/mL, the ratio is a plain number, often written as X:1. For example, an LH of 12 mIU/mL and an FSH of 4 mIU/mL gives a ratio of 3.0, written 3:1. Note that mIU/mL and IU/L are numerically identical units, so a lab reporting 4 IU/L is the same as 4 mIU/mL.
In a healthy woman tested in the early follicular phase, LH and FSH are roughly balanced and the ratio sits near 1:1. Published work describes the ratio in healthy women as usually lying between 1 and 2, and it may reach 2 or 3 in women with PCOS. The balance can shift for purely physiological reasons across the cycle: LH surges sharply just before ovulation, so a sample drawn near mid-cycle will show a very high ratio that has nothing to do with PCOS. That is why cycle-day timing is the single most important quality check on this calculation.
Why the ratio matters in a PCOS workup
Polycystic ovary syndrome is one of the most common endocrine disorders in reproductive-age women, and its hormonal signature often includes relatively high LH compared with FSH. The mechanism is neuroendocrine: in many women with PCOS, the hypothalamus releases gonadotropin-releasing hormone in faster pulses, which favours LH secretion over FSH secretion. The result is an LH to FSH ratio that climbs above the usual 1:1 balance. Studies report elevated ratios in a substantial share of women with PCOS, roughly 60 percent in some older series, which is why clinicians have ordered this ratio for decades as part of the workup for irregular cycles and suspected androgen excess.
Yet the ratio was never promoted to a diagnostic criterion, and modern guidance is explicit about that. The 2018 international evidence-based PCOS guideline (Teede et al., Human Reproduction) concluded that gonadotropin levels, including the LH to FSH ratio, should not be relied upon alone to diagnose PCOS, because sensitivity and specificity are both limited and the ratio varies with the assay used. In plain terms, the ratio is a supporting actor, not the star of the diagnostic show. It adds information when the clinical picture is unclear, and it is at its most useful when combined with the Rotterdam criteria described below.
How to measure the ratio correctly
Three measurement rules keep the ratio meaningful. First, draw the blood on cycle day 2 to 5, where day 1 is the first day of full menstrual flow, not spotting. This is the early follicular phase, when both gonadotropins are at their baseline. A sample drawn near ovulation, in the luteal phase, or during an anovulatory bleed without a true period can produce a misleading ratio. Second, use one blood draw for both hormones, from the same sample, so the values are directly comparable. Third, make sure neither hormone is being suppressed or stimulated by medication: combined hormonal contraception suppresses gonadotropins and makes the ratio uninterpretable, while ovulation-induction drugs and trigger shots distort LH and FSH directly. The calculator above asks for the cycle day so it can flag results drawn outside the day 2-5 window.
Laboratory variation matters more than most people expect. Different assay platforms measure LH and FSH slightly differently, which shifts the numeric cutoff. One careful study documented that the cutoff separating normal from PCOS-type patterns moved from the conventional 2.0 down to 1.0 or above with a more sensitive assay. This means a ratio of 1.8 could look reassuring on one lab report and borderline on another. Always read your result against the reference ranges printed on your own report, and treat the published cutoffs used by this calculator as widely cited anchors rather than laboratory-specific thresholds.
Interpreting your result
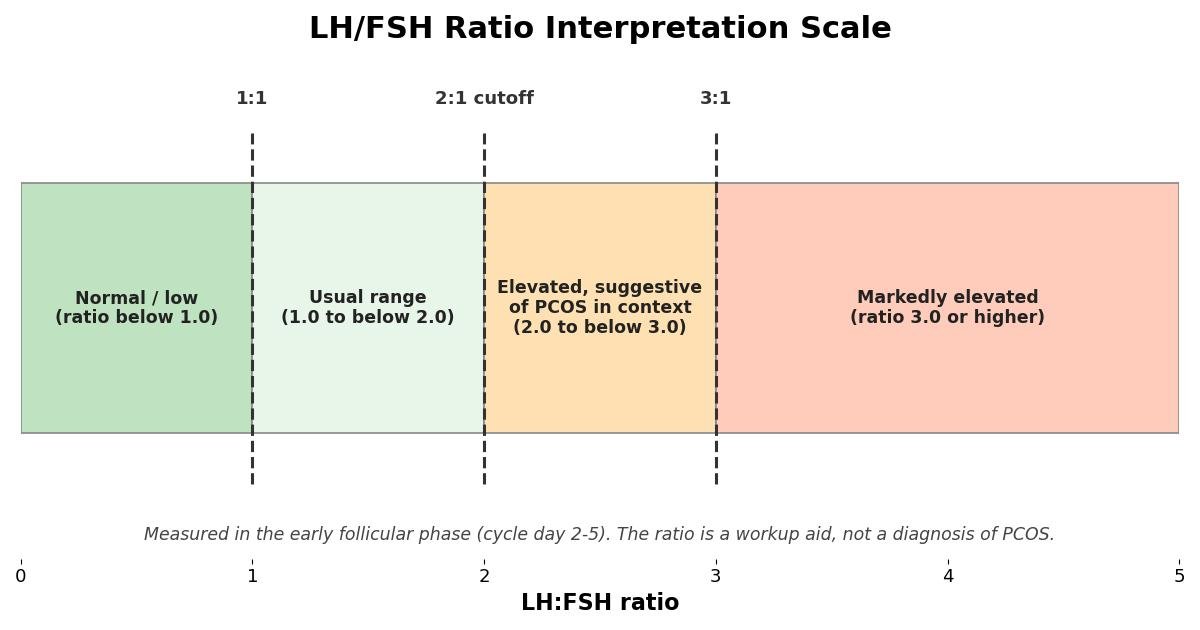
| LH:FSH ratio | Interpretation band | What it means |
|---|---|---|
| Below 1.0 | Normal / low | LH below FSH. Typical for the early follicular phase and not suggestive of PCOS on its own. |
| 1.0 to below 2.0 | Within usual range | The ratio healthy women usually show. PCOS is neither supported nor excluded; many women with PCOS fall in this range. |
| 2.0 to below 3.0 | Elevated, suggestive in context | The conventional cutoff. In a woman with irregular cycles or signs of androgen excess, this supports a PCOS workup. Without such features, it means little. |
| 3.0 or higher | Markedly elevated | A stronger signal in the right clinical context, but still not diagnostic by itself. Confirm timing and exclude confounders before acting. |
The Rotterdam criteria: the actual diagnostic standard
PCOS is diagnosed clinically, not by any single hormone ratio. The Rotterdam consensus (ESHRE/ASRM, 2003) defines PCOS as the presence of at least two of three features: oligo-ovulation or anovulation (infrequent or absent ovulation), clinical or biochemical hyperandrogenism (signs such as hirsutism or acne, or elevated androgen levels in blood), and polycystic ovarian morphology on ultrasound, after other causes of these findings have been excluded. This 2-of-3 rule remains the international standard and was reaffirmed by the 2018 evidence-based guideline.
The exclusion step is not a formality. Thyroid disorders, hyperprolactinemia, non-classic congenital adrenal hyperplasia, and androgen-secreting tumors can all mimic parts of the PCOS picture, which is why a proper workup includes TSH, prolactin, and often 17-hydroxyprogesterone alongside the gonadotropins. Where does the LH to FSH ratio fit? It sits among the supporting laboratory clues that raise or lower suspicion while the clinician assembles the Rotterdam picture. An elevated ratio in a woman with irregular cycles and hirsutism strengthens the case for PCOS; a normal ratio in the same woman changes nothing about the diagnosis, because the Rotterdam criteria do not require it.
Day-3 FSH and ovarian reserve: the second job of the same blood draw
The same FSH value used in the ratio carries independent information about ovarian reserve, meaning the remaining quantity of eggs. Early follicular FSH is a stress test of the ovaries: as the follicle pool shrinks with age, the pituitary must release more FSH to recruit a follicle, so day-3 FSH rises. The widely used bands are straightforward. An FSH below 10 mIU/mL is generally reassuring. A value from 10 to 15 mIU/mL is borderline and may reflect early decline, which is time-sensitive for fertility planning. A value above 15 mIU/mL suggests diminished ovarian reserve, and very high values above 40 mIU/mL fall in the menopausal range. The calculator reports this reserve note alongside the ratio so one blood draw yields both answers.
Day-3 FSH has a well-known blind spot that is worth knowing. A high estradiol on the same blood draw suppresses FSH through negative feedback and can mask a diminished reserve, making a borderline result look normal. Fertility specialists therefore look at FSH together with same-day estradiol; an estradiol above roughly 75 to 80 pg/mL on day 3 means a normal-looking FSH cannot be trusted. FSH also varies from cycle to cycle, and its meaning shifts with age: an FSH of 12 mIU/mL carries different weight at age 30 than at age 40. Modern reserve assessment pairs FSH with anti-Mullerian hormone (AMH) and the antral follicle count on ultrasound rather than relying on FSH alone.
Common reasons for a misleading ratio
Several everyday situations distort the ratio, and checking for them avoids false alarms. Blood drawn on the wrong cycle day is the most common: even a day-7 sample can look different from a day-3 sample, and anything near the ovulatory surge produces a dramatically high ratio. Hormonal contraception, including pills, patches, rings, and hormonal IUDs to a lesser extent, suppresses the pituitary-ovarian axis and flattens both values. Fertility medications such as clomiphene, letrozole, and injectable gonadotropins directly manipulate LH and FSH. Pregnancy, breastfeeding, significant weight change, intense endurance training, and acute stress can all move the numbers. Finally, remember that assay differences between laboratories shift cutoffs, so a ratio should ideally be compared against your own lab's reference intervals rather than a universal number.
It is equally important to know that a normal ratio does not rule out PCOS. A large proportion of women who meet the Rotterdam criteria have an LH to FSH ratio comfortably below 2.0, especially women with higher body weight, in whom LH tends to be lower. The ratio is an asymmetric clue: clearly elevated values add information, but normal values subtract very little. If your cycles are irregular or you have signs of excess androgens, the next step is a clinician-led workup regardless of what this calculator reports.
Worked example
Suppose a 28-year-old has blood drawn on cycle day 3, not taking hormonal contraception. Her LH is 12 mIU/mL and her FSH is 4 mIU/mL. Dividing 12 by 4 gives a ratio of 3.0, which falls in the markedly elevated band. Her day-3 FSH of 4 mIU/mL is in the reassuring range for ovarian reserve. The correct reading: the elevated ratio supports further PCOS evaluation if she also has irregular cycles or androgen excess, and it satisfies none of the Rotterdam criteria by itself. Now suppose instead her LH were 5 and her FSH 5: the ratio is 1.0, within the usual range, and no PCOS signal comes from the gonadotropins at all.
What to do with your result
Use the calculator output as a structured starting point for a medical conversation, not as an answer. If your ratio is elevated and you have irregular periods, acne, unwanted hair growth, or difficulty conceiving, bring the result to your clinician along with the cycle day and a list of any medications or supplements, because the interpretation depends on those details. Useful follow-up tests your clinician may order include total and free testosterone, DHEAS, 17-hydroxyprogesterone, TSH, prolactin, and a pelvic ultrasound for ovarian morphology, plus AMH and antral follicle count if fertility is the question. If your ratio is normal but symptoms persist, the same workup applies, since the Rotterdam diagnosis does not require an elevated ratio. Keep a record of the actual numbers with their units and the laboratory name, because comparing ratios across different labs without the assay context is unreliable.
References
- Rotterdam ESHRE/ASRM-Sponsored PCOS Consensus Workshop Group. Revised 2003 consensus on diagnostic criteria and long-term health risks related to polycystic ovary syndrome. Fertil Steril. 2004;81(1):19-25. doi:10.1016/j.fertnstert.2003.10.004
- Teede HJ, Misso ML, Costello MF, et al. Recommendations from the international evidence-based guideline for the assessment and management of polycystic ovary syndrome. Hum Reprod. 2018;33(9):1602-1618. doi:10.1093/humrep/dey256
- Saadia Z. Follicle stimulating hormone (LH: FSH) ratio in polycystic ovary syndrome. Middle East Fertil Soc J. 2020;25:5. doi:10.1186/s43043-021-00085-0 (reports the ratio usually lies between 1 and 2 in healthy women and may reach 2 or 3 in PCOS).
- Taylor AE, et al. Clinical phenotypes of PCOS: a cross-sectional study. Reprod Sci. 2023. doi:10.1007/s43032-023-01262-4 (documents the conventional cutoff of 2.0 and assay-dependent shift to 1.0 or above).
- Hsu MI, et al. Predictive value of LH/FSH ratio for ovulation induction in patients with polycystic ovary syndrome. (Reports an LH:FSH ratio above 1 as the best decision threshold in that cohort.)
- American Society for Reproductive Medicine. Diagnostic evaluation of the infertile female: a committee opinion. Fertil Steril. (Day-3 FSH interpretation framework: below 10 mIU/mL reassuring, 10-15 borderline, above 15 diminished reserve.)
- American College of Obstetricians and Gynecologists
- WHO: Women's Health
Key takeaways
- In healthy women tested in the early follicular phase (cycle day 2-5), the LH to FSH ratio is usually around 1 to 1, and ratios from 1.0 up to just below 2.0 are generally considered within the usual range.
- A ratio of 2.0 or higher is the conventional cutoff that raises suspicion of PCOS when the clinical picture fits, and a ratio of 3.0 or higher is a stronger signal.
- No.
- A day-3 FSH below 10 mIU/mL is generally reassuring, 10 to 15 mIU/mL is borderline and may reflect early decline, and above 15 mIU/mL suggests diminished ovarian reserve.
Frequently asked questions
What is a normal LH to FSH ratio?
In healthy women tested in the early follicular phase (cycle day 2-5), the LH to FSH ratio is usually around 1 to 1, and ratios from 1.0 up to just below 2.0 are generally considered within the usual range. The exact reference range depends on the laboratory and assay, so always interpret your result against the range printed on your own report.
What LH to FSH ratio suggests PCOS?
A ratio of 2.0 or higher is the conventional cutoff that raises suspicion of PCOS when the clinical picture fits, and a ratio of 3.0 or higher is a stronger signal. There is no single agreed cutoff: published studies have used 2.0, 3.0, and even assay-dependent thresholds near 1.0. An elevated ratio supports a PCOS workup but never confirms PCOS on its own.
Can the LH to FSH ratio diagnose PCOS?
No. PCOS is diagnosed with the Rotterdam criteria: at least two of three findings, namely oligo- or anovulation, clinical or biochemical hyperandrogenism, and polycystic ovarian morphology on ultrasound, after excluding other causes. The LH to FSH ratio is only a workup aid that adds information alongside symptoms, androgen levels, and ultrasound.
What does a day 3 FSH level mean for ovarian reserve?
A day-3 FSH below 10 mIU/mL is generally reassuring, 10 to 15 mIU/mL is borderline and may reflect early decline, and above 15 mIU/mL suggests diminished ovarian reserve. FSH varies between cycles and between assays, so a single result should be interpreted with age, estradiol, AMH, and antral follicle count.
When should LH and FSH be measured in the cycle?
LH and FSH for the ratio should be drawn in the early follicular phase, on cycle day 2 to 5, where day 1 is the first day of full menstrual flow. Measuring later in the cycle, near ovulation, or while on hormonal contraception gives misleading values and the ratio cannot be interpreted.
Why is my LH higher than my FSH if I do not have PCOS?
A high LH relative to FSH has many explanations besides PCOS: blood drawn at the wrong cycle day (near the ovulatory surge), recent ovulation induction medication, assay differences, stress or intense exercise effects on LH pulsatility, and natural cycle-to-cycle variation. Many women with PCOS also have a completely normal ratio, so the result must be read in full clinical context.