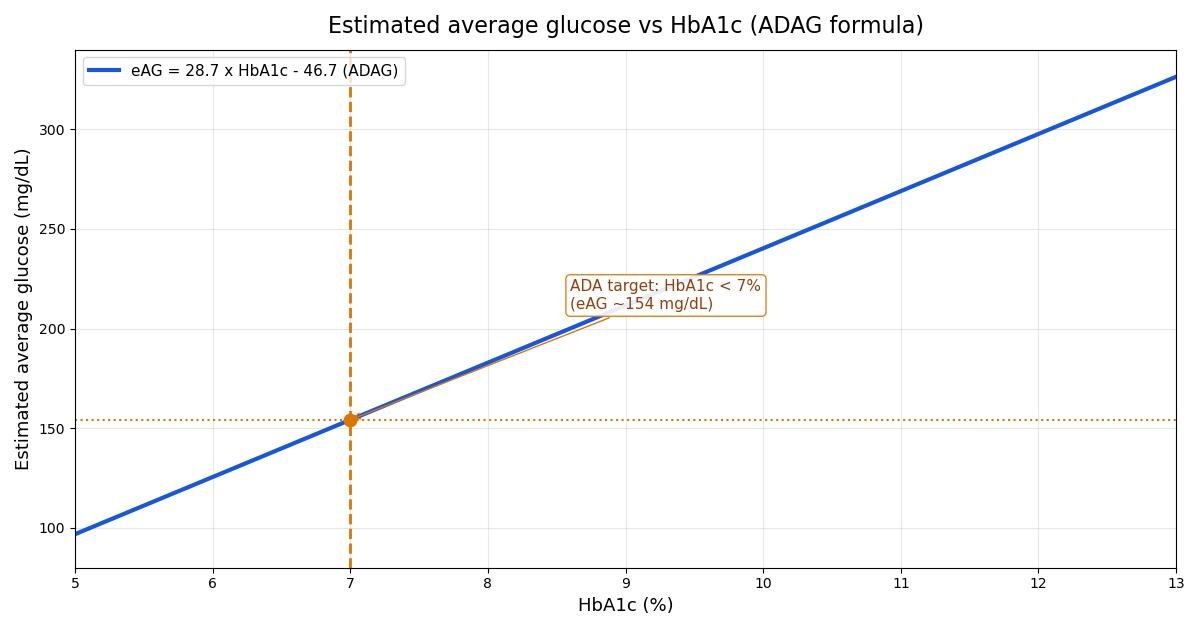
This HbA1c to average glucose calculator converts a laboratory HbA1c result into estimated average glucose (eAG), reported in both mg/dL and mmol/L, using the equation from the international ADAG study. It also works in reverse: enter an average glucose value and it estimates the matching HbA1c. Every result is a statistical estimate rather than a direct measurement, so the sections below explain where the numbers come from, when they are useful, and the conditions under which they break down.
HbA1c to average glucose lookup table (5-13%)
The table below lists common HbA1c values with their estimated average glucose in both units, calculated from the ADAG equation eAG (mg/dL) = 28.7 x HbA1c(%) - 46.7, with mmol/L values obtained by dividing by 18.016. The calculator above produces the same numbers for any value, including ones between the rows.
| HbA1c (%) | Estimated average glucose (mg/dL) | Estimated average glucose (mmol/L) |
|---|---|---|
| 5.0 | 96.8 | 5.37 |
| 6.0 | 125.5 | 6.97 |
| 7.0 | 154.2 | 8.56 |
| 8.0 | 182.9 | 10.15 |
| 9.0 | 211.6 | 11.75 |
| 10.0 | 240.3 | 13.34 |
| 11.0 | 269.0 | 14.93 |
| 12.0 | 297.7 | 16.52 |
| 13.0 | 326.4 | 18.12 |
What HbA1c measures
HbA1c, or glycated hemoglobin, is the fraction of hemoglobin molecules in red blood cells that have glucose attached to them. Glucose binds to hemoglobin continuously while red blood cells circulate, so the proportion that becomes glycated reflects average blood glucose over the lifespan of those cells, roughly 2 to 3 months. A single HbA1c result therefore summarizes months of glucose exposure in one number, which is why clinicians use it to judge long-term control rather than a single moment.
Laboratories report HbA1c as a percentage aligned to the Diabetes Control and Complications Trial (DCCT) reference, which is the scale most patients know. Many laboratories also report the IFCC reference scale in mmol/mol: for reference, 6.5% corresponds to 48 mmol/mol and 7.0% to 53 mmol/mol. The percentage scale is used throughout this page and in the calculator above.
HbA1c is valuable precisely because it is not a momentary reading. A fasting glucose of 126 mg/dL on one morning says little about the previous weeks, while an HbA1c of 8.0% tells a clinician that average glucose has been running near 183 mg/dL for months. The limitation, which the ADAG study addressed, is that percentages mean little to patients who manage their diabetes in mg/dL or mmol/L on a meter. Estimated average glucose bridges that gap.
The ADAG study
The A1C-Derived Average Glucose (ADAG) study was an international multicenter trial designed to answer one question: can HbA1c be reliably translated into the same glucose units patients use every day? The investigators enrolled 507 participants from 10 centers: 268 with type 1 diabetes, 159 with type 2 diabetes, and 80 without diabetes. Over about 3 months, each participant underwent continuous glucose monitoring on at least 2 days per month and seven-point fingerstick monitoring at least 3 days per week, yielding roughly 2,700 glucose values per person. Those measurements were then compared with HbA1c values drawn over the same period.
The study was published as Nathan DM, Kuenen J, Borg R, et al., "Translating the A1C Assay into Estimated Average Glucose Values," Diabetes Care. 2008;31(8):1473-1478 (doi:10.2337/dc08-0545). The resulting regression equation, derived from the continuous monitoring data, was: average glucose (mg/dL) = 28.7 x A1C(%) - 46.7. The correlation was strong, with r squared of 0.84 (a correlation coefficient r of approximately 0.92), which supported reporting HbA1c alongside an estimated average glucose in the same units as self-monitoring.
Two caveats from the study design matter for interpreting the numbers. First, the cohort was predominantly White (about 83%, with 8% Black and 8% Hispanic participants), and the investigators excluded people with liver disease, kidney disease, or other conditions that alter red blood cell lifespan, so the equation is best validated for people without those conditions. Second, the investigators were clear that estimated average glucose was not meant to replace HbA1c: it is a reporting aid, while HbA1c remains the standardized measure used for diagnosis and targets.
How estimated average glucose is derived
The calculator applies the ADAG regression equation directly:
For an HbA1c of 7.0%, the arithmetic is: 28.7 x 7.0 = 200.9, then 200.9 - 46.7 = 154.2 mg/dL. To express this in mmol/L, the mg/dL value is divided by 18.016, the exact conversion factor between the two glucose units: 154.2 / 18.016 = 8.56 mmol/L. You may also see the equation written directly in mmol/L as eAG (mmol/L) = 1.5944 x HbA1c - 2.5944, which is simply the mg/dL equation divided by 18 for convenience; this calculator divides by the exact 18.016 so both unit displays stay consistent.
The reverse conversion inverts the same equation:
So an average glucose of 126 mg/dL corresponds to (126 + 46.7) / 28.7 = 6.02%, rounded to 6.0%. If you enter glucose in mmol/L, the calculator first multiplies by 18.016 to get mg/dL and then applies the inversion. The relationship is approximately linear across the 5 to 13% range covered by the study, which is why a straight line describes it well on the chart above.
How clinicians use HbA1c targets
The American Diabetes Association recommends an HbA1c target below 7.0% for many nonpregnant adults, which the table above translates to an estimated average glucose below about 154 mg/dL (8.6 mmol/L). This target exists because keeping HbA1c in this range reduces the risk of microvascular complications such as retinopathy, nephropathy, and neuropathy. Expressing the target as an eAG helps patients connect a laboratory goal with the numbers they see on their meter each day.
Targets are individualized rather than one-size-fits-all. A tighter target near 6.5% may be reasonable for younger patients with a short duration of diabetes, long life expectancy, and no significant cardiovascular disease, provided it can be reached without significant hypoglycemia. A less strict target near 8.0% may be more appropriate for patients with a history of severe hypoglycemia, limited life expectancy, advanced microvascular or macrovascular complications, or extensive comorbid conditions. These tiers come from the ADA Standards of Care and reflect the trade-off between the benefits of tight control and the risks of hypoglycemia.
HbA1c also defines diagnosis, not just targets. An HbA1c of 6.5% or higher on a standardized laboratory assay indicates diabetes (with confirmatory testing in the absence of unequivocal hyperglycemia), while 5.7 to 6.4% indicates the prediabetes range. A fasting plasma glucose of 126 mg/dL or higher and a 2-hour oral glucose tolerance test value of 200 mg/dL or higher are the parallel glucose-based criteria. Because the ADAG equation is only an estimate, clinicians diagnose from the laboratory HbA1c itself, never from a converted eAG.
Limitations: when the HbA1c to average glucose relationship breaks down
The ADAG equation is a regression line fitted through real data, which means individual points scatter around it. An r squared of 0.84 is strong for clinical research, but it still leaves meaningful variation: two people with the same HbA1c can have genuinely different average glucose levels. Some of this scatter reflects individual differences in how readily hemoglobin glycates and how long red blood cells survive, differences the study could not fully explain.
Several medical conditions distort the relationship more systematically. Anemia, hemoglobinopathies (such as sickle cell trait or disease), chronic kidney disease with uremia, recent blood transfusion, and erythropoietin therapy all change red blood cell turnover or hemoglobin structure, which can push HbA1c misleadingly high or low relative to true average glucose. The ADAG investigators excluded people with liver disease, kidney disease, and other conditions affecting red blood cell lifespan precisely because the equation is unreliable for them. If you have one of these conditions, your clinician may monitor control with meter or sensor averages rather than relying on HbA1c alone.
Sampling differences add another layer. A meter average only reflects the moments you test, so it can miss overnight highs or post-meal peaks that HbA1c silently captures, while HbA1c smooths over dangerous lows. Finally, the study population was mostly White, so the equation is less validated in other populations. The ADA Standards of Care advise that marked discordance between HbA1c and repeated blood glucose measurements should raise the possibility of a problem or interference with either test: persistent disagreement is a reason to investigate, not to pick whichever number you prefer.
Key takeaways
- Estimated average glucose (eAG) is a translation of an HbA1c percentage into the same units used on home glucose meters (mg/dL or mmol/L).
- The ADAG study found a strong but imperfect correlation between HbA1c and average glucose (r squared = 0.84, so r is approximately 0.92).
- No.
- Several factors can create a gap between a meter average and the eAG predicted from HbA1c.
Frequently asked questions
What is estimated average glucose (eAG)?
Estimated average glucose (eAG) translates an HbA1c percentage into the glucose units used on home meters, mg/dL or mmol/L. It comes from the ADAG regression equation, eAG (mg/dL) = 28.7 x HbA1c(%) - 46.7, published in Diabetes Care in 2008. For example, an HbA1c of 7.0% corresponds to an eAG of about 154 mg/dL (8.6 mmol/L). It is a statistical estimate with scatter around the regression line, not a direct measurement of your blood sugar.
How accurate is eAG compared with my glucose meter average?
The ADAG study found a strong but imperfect correlation between HbA1c and average glucose (r squared = 0.84, so r is approximately 0.92). In practice, an individual's true average glucose can sit noticeably above or below the eAG predicted from their HbA1c. Differences in red blood cell lifespan, glycation tendency, and conditions such as anemia or kidney disease add further scatter. Treat eAG as a useful approximation for conversation and goal-setting, and rely on meter or continuous glucose monitoring averages for day-to-day treatment decisions.
Can I use this calculator to diagnose diabetes?
No. This calculator is an educational tool and cannot diagnose diabetes or any other condition. Diabetes is diagnosed with a laboratory HbA1c of 6.5% or higher, confirmed on repeat testing, or with established glucose criteria (fasting plasma glucose 126 mg/dL or higher, or 2-hour oral glucose tolerance test glucose 200 mg/dL or higher), interpreted by a clinician. If your HbA1c is elevated, discuss it with your clinician rather than relying on an online estimate.
Why does my meter average not match the eAG from my HbA1c?
Several factors can create a gap. Meters only record glucose at the moments you test and miss overnight or between-meal readings. HbA1c reflects roughly 2 to 3 months of exposure, while a meter average may cover only a few weeks. Medical conditions that change red blood cell turnover, including anemia, hemoglobinopathies, chronic kidney disease, recent blood transfusion, and erythropoietin therapy, can distort HbA1c in either direction. Marked, repeated discordance between HbA1c and glucose measurements should prompt a conversation with your clinician, who may check for assay interference or use an alternative measure such as fructosamine.
What HbA1c target should I aim for?
The American Diabetes Association recommends an HbA1c target below 7.0% (about 154 mg/dL or 8.6 mmol/L average glucose) for many nonpregnant adults, but targets are individualized. A tighter target near 6.5% may suit younger people with a short duration of diabetes and no cardiovascular disease if it can be reached without significant hypoglycemia. A looser target near 8.0% may be appropriate for people with a history of severe hypoglycemia, limited life expectancy, or advanced complications. Your clinician sets the target that balances benefit and risk for you.
Does eAG replace HbA1c?
No. The ADAG investigators stated explicitly that estimated average glucose was not intended to replace HbA1c. HbA1c remains the standard measure for diagnosis, risk assessment, and treatment targets because it is standardized across laboratories. eAG is a reporting aid that expresses the same result in units patients recognize from their meters, making conversations about goals clearer. Laboratories and clinicians continue to use HbA1c itself for clinical decisions.