What this HOMA-IR insulin resistance calculator measures
This HOMA-IR insulin resistance calculator computes two numbers from your fasting insulin and fasting glucose: HOMA-IR, an estimate of insulin resistance, and HOMA-B, an estimate of pancreatic beta-cell function. Both come from the homeostasis model assessment (HOMA) published by Matthews and colleagues in the journal Diabetologia in 1985. The model treats fasting glucose and fasting insulin as the steady-state result of a feedback loop between the liver, the pancreas, and insulin-sensitive tissues. Enter values from a laboratory fasting blood draw (at least 8 hours without food), choose the glucose unit your lab report uses, and the calculator returns both indices with an interpretation band.
The calculator accepts glucose in mmol/L or mg/dL and converts internally using the standard factor (divide mg/dL by 18.018 to obtain mmol/L). HOMA-IR is calculated as (fasting insulin in µU/mL multiplied by fasting glucose in mmol/L) divided by 22.5, or equivalently (insulin multiplied by glucose in mg/dL) divided by 405. HOMA-B is calculated as (20 multiplied by insulin) divided by (glucose in mmol/L minus 3.5). The tool also guards the situations where the model breaks down: a glucose at or below 3.5 mmol/L makes HOMA-B mathematically undefined, and negative, zero, or missing inputs are rejected with a clear named message instead of a silent wrong number.
What is insulin resistance?
Insulin is the hormone released by the beta cells of the pancreas, mainly in response to food. It signals muscle, fat, and liver cells to take glucose out of the bloodstream and store it, and it tells the liver to stop producing new glucose. Insulin resistance means those tissues respond less strongly than normal to a given amount of insulin. The pancreas compensates at first by secreting extra insulin, so blood glucose can stay normal for years while fasting insulin creeps upward. That compensatory phase is exactly what HOMA-IR is designed to detect: a high fasting insulin paired with a normal or mildly raised fasting glucose produces a high HOMA-IR.
Over time, if the beta cells cannot keep up with the extra demand, glucose control deteriorates through prediabetes toward type 2 diabetes. Insulin resistance is strongly associated with excess visceral fat, physical inactivity, and certain inherited predispositions, and it clusters with raised triglycerides, low HDL cholesterol, raised blood pressure, and fatty liver. Because the compensatory phase is silent, an estimate such as HOMA-IR can flag the problem years before glucose-based tests turn abnormal, which is why researchers and clinicians use it as an early risk signal rather than as a diagnosis.
What the HOMA model actually describes
The key idea of the 1985 paper is that in the fasting state, glucose and insulin settle into a balance determined by their interaction in a feedback loop. The liver releases glucose into the blood; the beta cells sense that glucose and release insulin in proportion; insulin in turn suppresses hepatic glucose output and promotes glucose uptake by tissues. If tissues become resistant, more insulin is needed to hold glucose steady, so the fasting pair shifts to higher insulin at roughly the same glucose. If beta cells fail, they cannot produce enough insulin and fasting glucose rises.
Matthews and colleagues built a computer-solved mathematical model of this loop and showed that comparing a patient's fasting glucose and insulin with the model's predictions allows a quantitative assessment of the two separate defects: insulin resistance and deficient beta-cell function. The two simple formulas used in this calculator are the practical approximations derived from that model. They assume a genuine fasting steady state: no food for at least 8 hours, no acute illness or severe physiological stress, and no drugs that disturb the loop. When those assumptions hold, the pair of numbers separates the two defects far better than either fasting glucose or fasting insulin alone.
The two equations, explained
The HOMA-IR equation estimates insulin resistance:
With glucose in mg/dL: HOMA-IR = (fasting insulin [µU/mL] x fasting glucose [mg/dL]) / 405
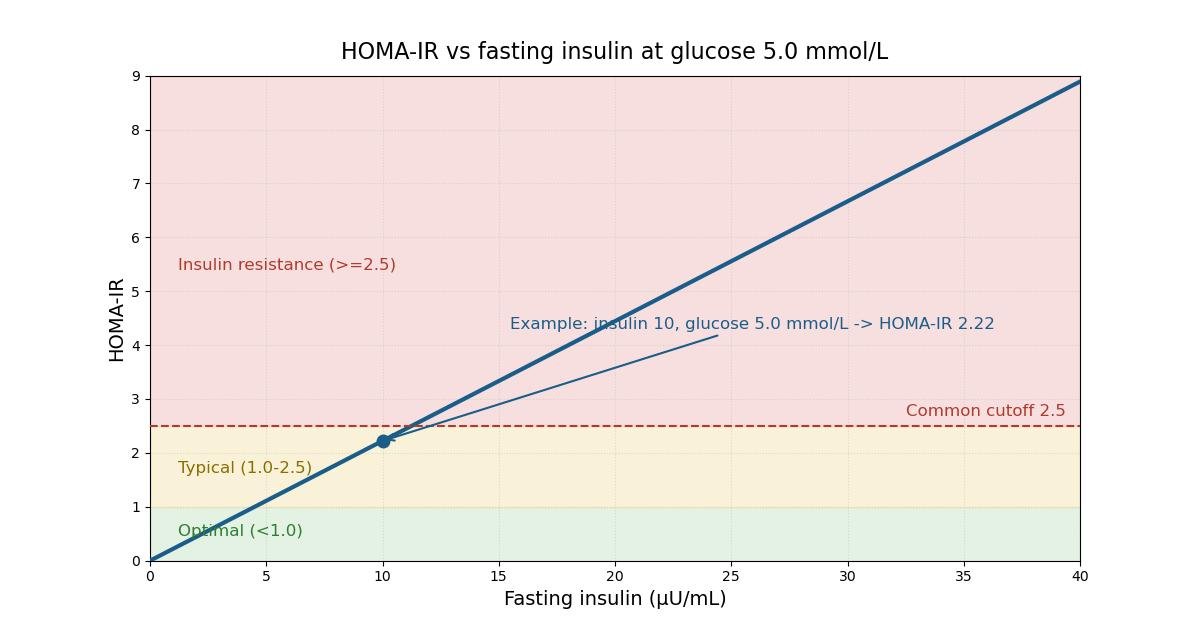
The divisor 22.5 (or 405 in mg/dL units) normalises the index so that a value of 1 represents the model's reference level of insulin sensitivity. A worked example: fasting insulin 10 µU/mL with fasting glucose 5.0 mmol/L gives (10 x 5.0) / 22.5 = 2.22. In mg/dL units the same sample reads about 90 mg/dL, and (10 x 90) / 405 = 2.22, the identical result.
The HOMA-B equation estimates beta-cell function:
With glucose in mg/dL: HOMA-B = (360 x fasting insulin [µU/mL]) / (fasting glucose [mg/dL] - 63)
For the same example, (20 x 10) / (5.0 - 3.5) = 200 / 1.5 = 133.3. The model's reference level for HOMA-B is 100, and the index is interpreted qualitatively: lower values indicate worse beta-cell function. Note the denominator: when fasting glucose approaches 3.5 mmol/L, the divisor approaches zero, which is why this calculator refuses glucose values at or below 3.5 mmol/L instead of returning a meaningless number.
HOMA-IR cutoffs and what they mean
There is no single universally agreed diagnostic threshold for HOMA-IR. The bands below reflect the cutoffs most commonly used in the research literature, and the calculator applies them:
| HOMA-IR | Interpretation |
|---|---|
| Below 1.0 | Optimal: indicates good insulin sensitivity. |
| 1.0 to below 2.5 | Typical range commonly reported for insulin-sensitive individuals in many studies. |
| 2.5 or above | Commonly used cutoff flagging insulin resistance. |
| 3.0 or above | Stricter cutoff used by some studies and in some populations. |
The most important caveat is assay variability: insulin is measured by immunoassays that differ between manufacturers and laboratories, so the same blood sample can produce different HOMA-IR values in different labs, and published cutoffs vary by population as well. For that reason, a single HOMA-IR value near a cutoff should not be over-interpreted. Trends measured with the same assay in the same laboratory are more informative than isolated numbers, and any result near or above 2.5 deserves discussion with a clinician rather than self-diagnosis.
When HOMA is not valid
The model only works when its assumptions hold. Do not rely on HOMA-IR or HOMA-B in these situations:
- Not fasting. Both values must come from a sample drawn after at least 8 hours without food. A recent meal raises both glucose and insulin and the steady-state assumption collapses.
- Exogenous insulin therapy. Injected insulin is measured by the laboratory assay, so the measured insulin no longer reflects the body's own feedback loop. HOMA interpretation is meaningless for people on insulin treatment.
- Insulin secretagogues. Drugs that force the pancreas to release more insulin, such as sulfonylureas, distort the fasting pair and invalidate the model.
- Acute illness or severe stress. Infection, surgery, trauma, and other acute stressors raise glucose and insulin through stress hormones, independent of underlying insulin sensitivity.
- Pregnancy. Pregnancy substantially changes insulin physiology, and HOMA has not been validated for use in pregnancy.
- Hypoglycaemia. A fasting glucose at or below 3.5 mmol/L (about 63 mg/dL) makes HOMA-B undefined and signals that the fasting steady state does not hold; such a result needs clinical evaluation on its own merits.
How clinicians confirm insulin resistance
HOMA-IR is an estimate, not a diabetes diagnostic test. Diabetes is diagnosed from glucose-based criteria (fasting plasma glucose, HbA1c, or an oral glucose tolerance test) interpreted by a clinician. A high HOMA-IR is a risk signal that warrants follow-up, such as lifestyle review, repeat testing, and assessment of related risk factors.
The reference method for measuring insulin sensitivity directly is the hyperinsulinaemic-euglycaemic clamp: insulin is infused at a fixed rate while glucose is infused at a variable rate to hold blood sugar steady, and the glucose infusion rate required quantifies how sensitive the tissues are. The clamp is precise but laborious, which is why HOMA was developed. In their 1985 paper, Matthews and colleagues validated HOMA against clamp studies: the HOMA estimate of insulin resistance correlated with the euglycaemic clamp at Rs = 0.88 (p less than 0.0001) and with the hyperglycaemic clamp at Rs = 0.69 (p less than 0.01), while the HOMA beta-cell estimate correlated with the hyperglycaemic clamp at Rs = 0.61 (p less than 0.01) and with the intravenous glucose tolerance test at Rs = 0.64 (p less than 0.05).
The same paper reported the limits of the method honestly: coefficients of variation of 31 percent for the insulin resistance estimate and 32 percent for the beta-cell estimate, which the authors noted limits the precision of single-patient estimates. In practice this means HOMA-IR is excellent for research and population screening and useful as a clinical signal, but an individual result should be confirmed with repeat testing under proper fasting conditions and interpreted alongside the full clinical picture.
Key takeaways
- Values below 1.0 indicate good insulin sensitivity, values from 1.0 to below 2.5 fall in the range commonly reported for insulin-sensitive individuals, and 2.5 is the cutoff most often used to flag insulin resistance.
- Yes.
- No.
- No.
Frequently asked questions
What is a normal HOMA-IR value?
Values below 1.0 indicate good insulin sensitivity, values from 1.0 to below 2.5 fall in the range commonly reported for insulin-sensitive individuals, and 2.5 is the cutoff most often used to flag insulin resistance. Cutoffs vary by insulin assay and population, and some studies use 3.0, so a single value should always be interpreted by a clinician who knows which assay your laboratory uses.
Do I need to fast before the blood test used for HOMA-IR?
Yes. Both inputs must come from a fasting blood sample drawn after at least 8 hours without food, because the HOMA model assumes a steady state in which fasting glucose and fasting insulin reflect the balance of a feedback loop. A non-fasting sample, or a sample taken during acute illness or severe stress, violates that assumption and makes the result meaningless.
Can I use HOMA-IR if I take insulin or diabetes medication?
No. HOMA is not valid for people on exogenous insulin therapy, because injected insulin is measured by the laboratory assay and breaks the feedback-loop assumption the model depends on. Drugs that stimulate the pancreas to release more insulin, such as sulfonylureas, also invalidate the interpretation. Discuss insulin resistance assessment with the clinician who prescribes your medication.
Is HOMA-IR a diabetes test?
No. HOMA-IR estimates insulin resistance; it does not diagnose diabetes. Diabetes is diagnosed from glucose-based criteria such as fasting plasma glucose, HbA1c, or an oral glucose tolerance test, interpreted by a clinician. A high HOMA-IR is a risk signal that deserves clinical follow-up, not a diagnosis.
Why does the calculator refuse a glucose value at or below 3.5 mmol/L?
The HOMA-B equation divides by (fasting glucose in mmol/L minus 3.5), so at exactly 3.5 the denominator is zero and the result is undefined. More importantly, a fasting glucose that low indicates hypoglycaemia, which means the fasting steady state the model assumes does not hold. The calculator blocks the computation instead of returning a misleading number.
How accurate is HOMA-IR compared with the glucose clamp?
In the original 1985 validation, the HOMA estimate of insulin resistance correlated with the euglycaemic clamp at Rs = 0.88 and with the hyperglycaemic clamp at Rs = 0.69, while the beta-cell estimate correlated with the hyperglycaemic clamp at Rs = 0.61 and with the intravenous glucose tolerance test at Rs = 0.64. The same paper reported coefficients of variation of 31 percent for insulin resistance and 32 percent for the beta-cell estimate, which the authors noted limits the precision of single-patient estimates. HOMA is therefore widely used in research and screening, while the clamp remains the reference method.
References
- Matthews DR, Hosker JP, Rudenski AS, Naylor BA, Treacher DF, Turner RC. Homeostasis model assessment: insulin resistance and beta-cell function from fasting plasma glucose and insulin concentrations in man. Diabetologia. 1985;28(7):412-419. doi: 10.1007/BF00280883. PubMed record: PMID 3899825.
- Unit conversion used: 1 mmol/L glucose = 18.018 mg/dL (molecular weight of glucose 180.156 g/mol).