This LDL cholesterol calculator Friedewald estimates your low-density lipoprotein cholesterol from the three numbers on a standard lipid profile: total cholesterol, HDL cholesterol and triglycerides. It implements the equation published by Friedewald, Levy and Fredrickson in 1972, converts between mg/dL and mmol/L, and enforces the hard triglyceride limit above which the equation stops being trustworthy. Below the tool you will find a full explanation of what LDL is, how the equation works, why it divides triglycerides by 5, when to ask the laboratory for a directly measured LDL instead, and the guideline targets doctors use by risk tier.
What is LDL cholesterol?
LDL stands for low-density lipoprotein, one of the protein-wrapped packages that carry cholesterol through the blood. Cholesterol itself is essential: every cell membrane contains it, and it is the raw material for steroid hormones and bile acids. The problem is delivery. LDL particles ferry cholesterol from the liver out to the tissues, and when too many circulate, cholesterol is deposited in arterial walls, where it drives the formation of atherosclerotic plaques. That is why LDL cholesterol is usually called bad cholesterol, in contrast to HDL (high-density lipoprotein) cholesterol, which carries cholesterol back to the liver for disposal.
The number reported on a lipid profile, LDL-C, is the amount of cholesterol carried inside LDL particles, not a count of the particles themselves. Because the cholesterol content of LDL is the main driver of atherosclerotic cardiovascular disease risk that can be measured cheaply, LDL-C became the primary target of cholesterol-lowering treatment in national and international guidelines. Lowering LDL-C with statins, ezetimibe and PCSK9 inhibitors reduces cardiovascular events, and guidelines therefore frame treatment decisions around LDL-C thresholds and targets.
Most laboratories do not measure LDL-C directly for every patient. Direct measurement historically required preparative ultracentrifugation, an expensive, slow reference method impractical for routine care. Instead, laboratories estimate LDL-C from the other three numbers on the lipid panel. The Friedewald equation, published in 1972, was the first widely adopted estimation method, and despite refinements developed since, it remains the most commonly reported estimate in routine laboratory practice worldwide.
The Friedewald equation, step by step
In 1972, William T. Friedewald, Robert I. Levy and Donald S. Fredrickson published a method for estimating LDL cholesterol in plasma without using the preparative ultracentrifuge (Clinical Chemistry, volume 18, pages 499 to 502). Their insight was an accounting identity. Total cholesterol in fasting plasma is the sum of the cholesterol carried in each lipoprotein fraction: LDL, HDL and VLDL (very-low-density lipoprotein), with only minor contributions from the rest. Rearranged, that gives LDL cholesterol as total cholesterol minus HDL cholesterol minus VLDL cholesterol.
The difficulty is that VLDL cholesterol is not measured on a standard panel either. Friedewald and colleagues solved this by observing that, in fasting plasma, most triglycerides travel inside VLDL particles, and the mass ratio of triglycerides to cholesterol inside VLDL is roughly 5 to 1. VLDL cholesterol can therefore be approximated as triglycerides divided by 5. Substituting that estimate into the accounting identity gives the famous equation, in mg/dL:
In SI units (mmol/L), the divisor becomes 2.2:
Both versions are mathematically identical; only the units differ. A historical footnote: in a 2003 interview, Friedewald himself suggested the equation might more fairly have been called the Levy equation, after his co-author Robert Levy. The name Friedewald equation stuck regardless.
Why the formula divides triglycerides by 5
The number 5 is not a magic constant. It is an empirical estimate of the triglyceride to cholesterol mass ratio inside VLDL particles. In the fasting state, VLDL is the main triglyceride-carrying lipoprotein, and on average each VLDL particle carries about five times as much triglyceride mass as cholesterol mass. Dividing the plasma triglyceride concentration by 5 therefore estimates how much cholesterol is riding inside VLDL. Later work confirmed the approximation is reasonable on average: in the large validation study behind the Martin-Hopkins equation, the median triglyceride to VLDL cholesterol ratio across more than a million lipid profiles was 5.2.
The SI divisor of 2.2 comes from the same ratio after unit conversion. Cholesterol converts between mg/dL and mmol/L with a factor of 38.67, while triglycerides use 88.57, because the molecules have different molecular weights. Dividing the ratio 5 by the relative conversion factor (88.57 divided by 38.67, about 2.29) gives roughly 2.18, which is rounded to the conventionally used 2.2. So triglycerides divided by 5 in mg/dL and triglycerides divided by 2.2 in mmol/L are the same estimate expressed in different units.
The catch is the word average. The 5 to 1 ratio varies between people and across triglyceride levels: it is lower when triglycerides are low and higher when they are high. Applying the fixed factor of 5 to every patient is the central weakness of the Friedewald equation, and it is why refinements like Martin-Hopkins use an adjustable factor instead. It is also why the equation has a hard upper limit on triglycerides.
LDL cholesterol calculator Friedewald: the triglyceride validity limit
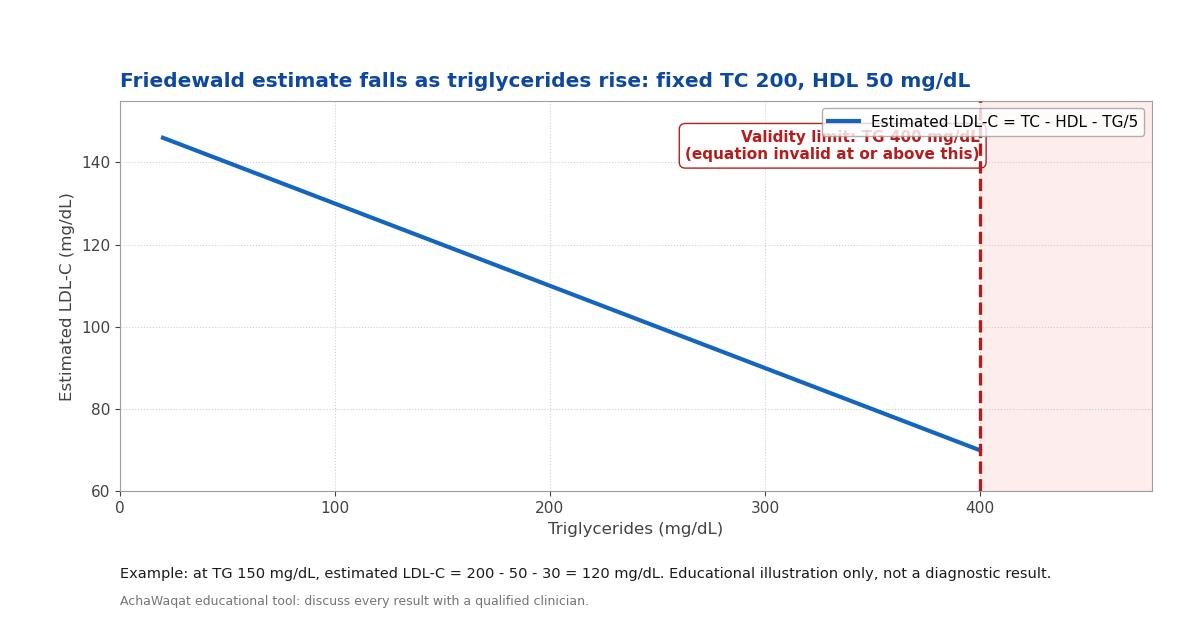
The Friedewald equation is unreliable when triglycerides reach 400 mg/dL (4.5 mmol/L) or higher, and this calculator refuses to compute a result in that range. Above that level, the plasma contains chylomicrons, large triglyceride-rich particles that appear after meals or in severe hypertriglyceridaemia, and the fixed 5 to 1 ratio between triglycerides and VLDL cholesterol collapses. The triglycerides divided by 5 term then overestimates VLDL cholesterol, and because VLDL cholesterol is subtracted from the total, the equation underestimates LDL cholesterol. The result is not just imprecise, it is misleading in the dangerous direction: it can hide a high LDL-C that needs treatment.
The degradation does not switch on suddenly at 400. Studies have shown the estimate grows increasingly inaccurate as triglycerides rise through roughly 200 to 400 mg/dL (2.3 to 4.5 mmol/L), and it is particularly prone to underestimating LDL-C when LDL-C itself is low and triglycerides are high, exactly the situation where correct classification matters most for treatment decisions. The 400 mg/dL line is a pragmatic cutoff below which the estimate is considered acceptable, not a guarantee of accuracy just beneath it.
When triglycerides are at or above the limit, or when the sample is non-fasting and chylomicrons are present, the correct answer is a directly measured LDL-C. The reference method is beta-quantification by ultracentrifugation, the technique the Friedewald equation was designed to replace; in routine practice, laboratories use direct homogeneous LDL-C assays. If your triglycerides are very high, ask your laboratory or clinician for a direct LDL measurement rather than any calculated estimate, including this one.
Closely related is the fasting question. Friedewald, Levy and Fredrickson validated their equation in fasting plasma, and the original paper emphasised chylomicron-free samples. A non-fasting triglyceride reading includes chylomicron triglycerides, inflating the triglycerides divided by 5 term and degrading the estimate. For the most reliable result, enter values from a fasting lipid profile, ideally drawn after 9 to 12 hours without food, and never enter a non-fasting triglyceride value and treat the output as equivalent to a fasting one.
Guideline LDL targets by risk tier
Knowing your LDL-C number is only half the story; the other half is what target applies to you. Treatment targets are set by cardiovascular risk, not by a single normal range, and they have moved lower over time as trials showed benefit from deeper LDL-C lowering. The figures below come from the 2018 AHA/ACC multisociety cholesterol guideline and the 2019 ESC/EAS dyslipidaemia guideline, summarised in a published transatlantic comparison.
The 2018 AHA/ACC guideline defines a very-high-risk group among patients with established atherosclerotic cardiovascular disease and uses an LDL-C threshold of 70 mg/dL (1.8 mmol/L) for considering additional therapy: when LDL-C remains at or above 70 mg/dL on a maximally tolerated statin, adding ezetimibe is reasonable, and if it still remains at or above 70 mg/dL on statin plus ezetimibe, a PCSK9 inhibitor may be considered. For severe primary hypercholesterolaemia, defined as LDL-C of 190 mg/dL (4.9 mmol/L) or higher, the guideline recommends starting high-intensity statin therapy without calculating 10-year risk; if LDL-C remains at or above 100 mg/dL on the statin, adding ezetimibe is reasonable. In adults aged 40 to 75 with diabetes and LDL-C of 70 mg/dL or higher, moderate-intensity statin therapy is recommended, with high-intensity statin reasonable for those at higher risk.
The European 2019 ESC/EAS guideline frames goals as targets to reach rather than thresholds for escalation: below 55 mg/dL (1.4 mmol/L) with at least a 50 percent reduction for very-high-risk patients, below 70 mg/dL (1.8 mmol/L) with at least a 50 percent reduction for high-risk patients, below 100 mg/dL (2.6 mmol/L) for moderate risk, and below 116 mg/dL (3.0 mmol/L) for low risk. The European targets are more aggressive at the top end than the American thresholds, which is why patients managed strictly to one guideline may not meet the other. Both guidelines agree on the direction: lower is better for high-risk patients, and the decision belongs to you and your clinician.
The Martin-Hopkins refinement
In 2013, Seth Martin and colleagues at Johns Hopkins published a more accurate way to estimate LDL-C from the standard lipid profile (JAMA, volume 310, pages 2061 to 2068). Instead of dividing triglycerides by the fixed number 5, their method divides by an adjustable factor chosen from a 180-cell table of median triglyceride to VLDL cholesterol ratios, keyed to the patient's triglyceride and non-HDL cholesterol levels. The table was derived from 1,350,908 lipid profiles collected across the United States between 2009 and 2011.
The improvement is real and clinically relevant. For patients with triglycerides below 400 mg/dL, the novel estimate agreed with directly measured LDL-C in guideline risk classification in 91.7 percent of cases, compared with 85.4 percent for the Friedewald equation. The largest gain was in classifying LDL-C below 70 mg/dL in patients with elevated triglycerides, precisely where Friedewald underestimates and where treatment decisions are most sensitive. The study authors noted that laboratories could implement the method at virtually no cost.
Even so, Martin-Hopkins does not solve the fundamental problem: it is still an estimate built on triglycerides, and it is still not recommended when triglycerides exceed 400 mg/dL. Where triglycerides are very high, or where precision matters most, direct LDL-C measurement remains the answer.
Limitations and assumptions of this calculator
This calculator inherits every assumption of the Friedewald equation. It assumes a fasting sample, triglycerides below 400 mg/dL, and the absence of chylomicrons and type III hyperlipoproteinaemia, a rare disorder in which cholesterol-enriched VLDL remnants break the ratio completely. It estimates LDL cholesterol only; it says nothing about lipoprotein(a), small dense LDL particles, or inflammation, all of which influence risk independently. If the calculator reports a negative LDL-C, your inputs are inconsistent (for example, HDL entered higher than total cholesterol), and it will flag this as an error rather than display a meaningless number. Treat the output as an estimate to discuss with your clinician, not as a laboratory result.
References
- Friedewald WT, Levy RI, Fredrickson DS. Estimation of the concentration of low-density lipoprotein cholesterol in plasma, without use of the preparative ultracentrifuge. Clinical Chemistry. 1972;18(6):499-502. DOI: 10.1093/clinchem/18.6.499.
- Grundy SM, Stone NJ; Guideline Writing Committee. 2018 Cholesterol Clinical Practice Guidelines: synopsis of the 2018 American Heart Association/American College of Cardiology/Multisociety Cholesterol Guideline. Annals of Internal Medicine. 2019.
- Martin SS, Blaha MJ, Elshazly MB, et al. Comparison of a novel method vs the Friedewald equation for estimating low-density lipoprotein cholesterol levels from the standard lipid profile. JAMA. 2013;310(19):2061-2068.
- Comparison of transatlantic approaches to lipid management: the AHA/ACC/Multisociety Guidelines vs the ESC/EAS Guidelines. Mayo Clinic Proceedings. 2020. Available at: mayoclinicproceedings.org.
- Endocrine Society
- American Diabetes Association
Key takeaways
- There is no single normal value: targets depend on cardiovascular risk.
- The Friedewald equation estimates VLDL cholesterol as triglycerides divided by 5, which assumes a fixed 5 to 1 ratio of triglycerides to cholesterol in VLDL particles.
- The Friedewald equation was developed and validated in fasting plasma.
- Divide cholesterol in mg/dL by 38.67 to get mmol/L, or multiply mmol/L by 38.67 to get mg/dL.
Frequently asked questions
What is a normal LDL cholesterol level?
There is no single normal value: targets depend on cardiovascular risk. The NCEP Adult Treatment Panel III classified LDL-C below 100 mg/dL (2.6 mmol/L) as optimal for the general population. The 2018 AHA/ACC cholesterol guideline uses an LDL-C threshold of 70 mg/dL (1.8 mmol/L) in very-high-risk atherosclerotic cardiovascular disease patients to consider adding nonstatin therapy to a maximally tolerated statin.
Why does the Friedewald calculator reject triglycerides of 400 mg/dL or more?
The Friedewald equation estimates VLDL cholesterol as triglycerides divided by 5, which assumes a fixed 5 to 1 ratio of triglycerides to cholesterol in VLDL particles. Above 400 mg/dL (4.5 mmol/L), chylomicrons and abnormal VLDL break that assumption, so the estimate becomes unreliable. In that situation, ask the laboratory for a directly measured LDL-C instead.
Do I need to fast before the blood test used in the Friedewald equation?
The Friedewald equation was developed and validated in fasting plasma. A non-fasting sample contains chylomicrons, which inflate the triglyceride reading and distort the triglycerides divided by 5 estimate of VLDL cholesterol. For the most accurate estimate, use values from a fasting lipid profile, ideally after 9 to 12 hours without food.
How do I convert LDL cholesterol between mg/dL and mmol/L?
Divide cholesterol in mg/dL by 38.67 to get mmol/L, or multiply mmol/L by 38.67 to get mg/dL. For example, 120 mg/dL equals 3.10 mmol/L. For triglycerides the conversion factor is different: divide mg/dL by 88.57. This calculator handles both unit systems automatically when you switch the unit toggle.
When is the Martin-Hopkins equation better than Friedewald?
Martin and colleagues (JAMA, 2013) replaced the fixed divisor of 5 with an adjustable factor drawn from a 180-cell table of median triglyceride to VLDL cholesterol ratios based on triglyceride and non-HDL cholesterol levels. In over 1.3 million lipid profiles it classified guideline risk correctly in 91.7 percent of cases versus 85.4 percent for Friedewald, with the largest advantage at LDL-C below 70 mg/dL in patients with elevated triglycerides. It still does not fix triglycerides above 400 mg/dL.
Can I use this calculator to change my statin dose?
No. This is an educational tool, not medical advice. Statin type, dose and treatment targets depend on your overall cardiovascular risk, other conditions, drug interactions and side effects, all of which need a clinician who knows your history. Take your result to your doctor or pharmacist and decide any change together.