What is the International Staging System for multiple myeloma?
Staging in cancer means assigning a patient to a group whose members tend to share a similar outlook, so that prognosis discussions, clinical trial comparisons and treatment planning start from a common language. For multiple myeloma, the staging system most of the world now uses is the International Staging System, usually shortened to ISS. It was published in 2005 by Greipp and colleagues on behalf of the International Myeloma Working Group in the Journal of Clinical Oncology, and it replaced the older Durie-Salmon system for routine use. Its appeal is its simplicity: the whole system runs on two blood tests that are measured in every myeloma workup, serum beta-2 microglobulin and serum albumin, and it sorts every patient into one of three stages with clearly different survival patterns in the development data.
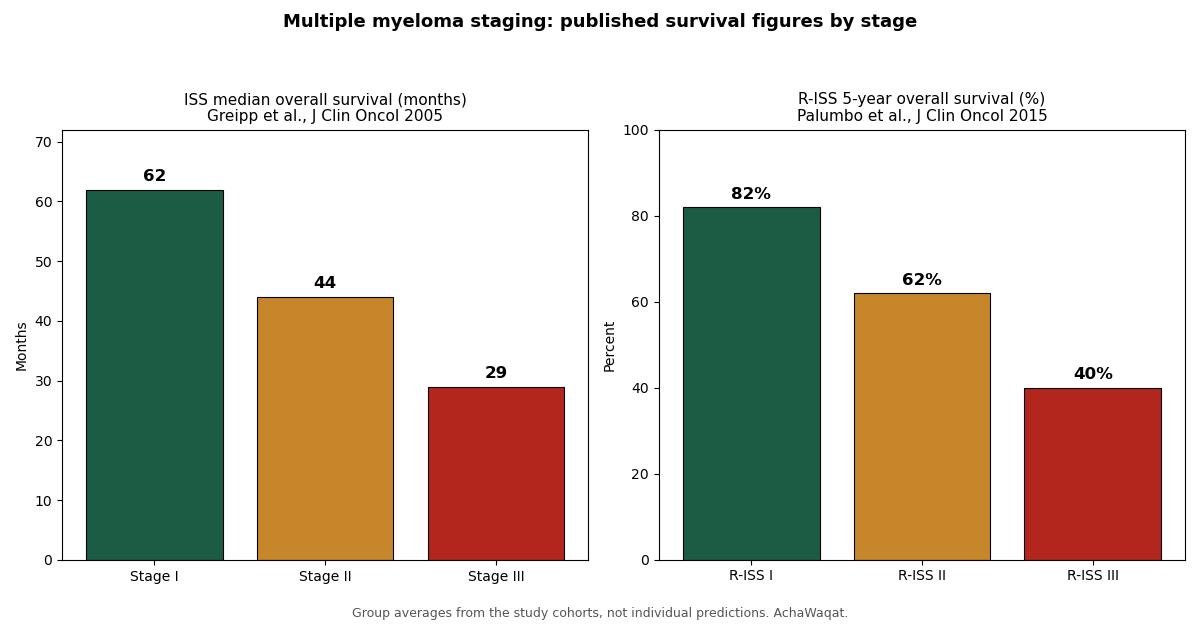
The ISS was not built on theory. It was built on data from 10,750 untreated patients with multiple myeloma drawn from clinical trials across North America, Europe and Asia, making it one of the largest staging datasets ever assembled in hematology. The researchers tested many candidate prognostic factors and found that a simple pair, beta-2 microglobulin with cut points at 3.5 and 5.5 mg/L and albumin with a cut point at 3.5 g/dL, stratified survival as well as or better than far more complicated combinations. Stage I was defined as beta-2 microglobulin below 3.5 mg/L together with albumin of at least 3.5 g/dL. Stage III was defined as beta-2 microglobulin of at least 5.5 mg/L regardless of albumin. Stage II was defined as everyone who fits neither definition. In that original cohort, the median overall survivals were 62 months for Stage I, 44 months for Stage II, and 29 months for Stage III, a spread wide enough that the stage genuinely mattered and narrow enough that the system could be validated.
It helps to be clear about what staging does and does not do. A stage is a prognostic label, not a diagnosis and not a treatment prescription. It does not tell a patient whether they will respond to a particular drug, it does not by itself decide whether treatment should start now or later, and it certainly does not say how long any individual patient will live. What it does is place a patient on a risk map built from thousands of patients who came before, so that the conversation about what to expect and how intensively to treat starts with evidence rather than guesswork. This calculator computes that label exactly as the original paper defined it, nothing more.
Why beta-2 microglobulin and albumin?
Of all the numbers in a myeloma workup, why these two? Beta-2 microglobulin is a small protein that sits on the surface of nearly all nucleated cells and is shed into the blood continuously. Because myeloma fills the marrow with malignant plasma cells, the total tumor burden drives the serum level upward: more myeloma cells generally means more beta-2 microglobulin in the blood. There is a second reason it matters. Beta-2 microglobulin is cleared almost entirely by the kidneys, and myeloma frequently damages the kidneys through cast nephropathy and other mechanisms. When renal function falls, beta-2 microglobulin accumulates even if the tumor burden has not changed. So a high value captures two bad things at once, a large tumor load and failing kidneys, which is part of why it emerged as such a strong prognostic marker in the statistical analyses.
Serum albumin plays the opposite role in the pair. Albumin is made by the liver, and its level falls when the body is under chronic inflammatory stress, when nutrition is poor, and when the patient is generally unwell. In myeloma, inflammatory cytokines such as interleukin-6 are part of the disease biology and also suppress albumin production. A low albumin therefore marks the patient who is already being worn down by the disease, independent of how much tumor is present. This is why the ISS needs both numbers. Two patients can have the same beta-2 microglobulin and very different outlooks, and albumin is the variable that separates them. The combination distills two dimensions of prognosis, the amount of disease and the state of the host, into a three-stage label.
There is an important practical consequence. Because beta-2 microglobulin depends on renal function, an acute kidney injury from an unrelated cause can push a patient into a higher stage than the myeloma itself would justify, and because albumin responds to nutrition and inflammation, a concurrent infection or poor intake can do the same. Good staging uses values drawn when the patient is in a steady state, not in the middle of an intercurrent illness. The calculator cannot check that; it trusts the numbers entered. The treating team decides which values are representative.
How the ISS was developed
The 2005 study was a deliberate attempt to build a staging system the whole world could use. Earlier systems, particularly Durie-Salmon, relied on measurements such as the number of lytic bone lesions and estimates of tumor cell mass that were hard to standardize between centers. The International Myeloma Working Group instead collected routine laboratory data from trials run by cooperative groups on three continents, restricting the analysis to previously untreated patients so that therapy would not confound the prognostic signal. From this pooled dataset they evaluated dozens of candidate variables with multivariable models, and the combination of beta-2 microglobulin and albumin outperformed everything else while remaining trivially easy to measure.
The cut points themselves were chosen empirically, not by convention. The researchers searched the data for the thresholds that best separated survival curves, and they arrived at 3.5 and 5.5 mg/L for beta-2 microglobulin and 3.5 g/dL for albumin. The resulting three stages contained roughly balanced groups and produced the now familiar median survivals of 62, 44 and 29 months. Because the derivation cohort was so large and so diverse, the ISS transferred well across countries and practice settings, and subsequent studies confirmed its prognostic power in the era of novel agents such as thalidomide, bortezomib and lenalidomide, even as the absolute survival numbers improved with better treatment.
That last point deserves emphasis because it is the most common misunderstanding of the ISS. The median survivals of 62, 44 and 29 months describe patients treated mostly before modern myeloma therapy. They remain useful as a relative ordering, Stage I still does better than Stage II and Stage II better than Stage III in contemporary cohorts, but the absolute numbers are out of date. A Stage III patient treated today with a modern combination regimen does not, on average, have a median survival of 29 months. The calculator reports the published figures because they are the historical anchor of the system, and it states this limitation plainly.
Interpreting the ISS stages
The rules are short enough to state in full. Stage I requires two things at once: serum beta-2 microglobulin below 3.5 mg/L and serum albumin of at least 3.5 g/dL. Stage III requires one thing: serum beta-2 microglobulin of at least 5.5 mg/L, whatever the albumin. Stage II is the remainder, everyone who is neither Stage I nor Stage III. Note what this means in practice. A patient with beta-2 microglobulin of 2.0 mg/L and albumin of 2.8 g/dL is Stage II, not Stage I, because the albumin condition fails. A patient with beta-2 microglobulin of 7.0 mg/L and a perfectly normal albumin of 4.5 g/dL is Stage III, because the beta-2 microglobulin threshold alone is decisive. A patient sitting exactly on a boundary, 3.5 mg/L or 5.5 mg/L, belongs to the higher category, since the definitions use "at least" at those cut points.
| ISS stage | Definition | Median overall survival in the original cohort |
|---|---|---|
| Stage I | Beta-2 microglobulin below 3.5 mg/L AND albumin at least 3.5 g/dL | 62 months |
| Stage II | Neither Stage I nor Stage III | 44 months |
| Stage III | Beta-2 microglobulin at least 5.5 mg/L | 29 months |
Stage II is the least satisfying stage and the most honest one. It is a heterogeneous group: it contains patients who just miss Stage I on albumin, patients whose beta-2 microglobulin sits in the middle range, and everyone in between. Its median survival of 44 months sits between the other two, but individual patients in Stage II span a wide range of actual risk. This heterogeneity was one of the main motivations for the Revised ISS, which was built to separate the truly high-risk patients hiding inside Stages I and II from those with genuinely favorable biology.
Median survival itself needs a word of explanation, because it is widely misread. A median of 62 months does not mean the typical patient lives 62 months. It means that in the study cohort, half of the Stage I patients had died by 62 months and half were still alive. It is a property of the group, estimated from Kaplan-Meier curves, and it says nothing about the range: many Stage I patients lived far longer and some far shorter. Treating a median as a personal prediction is one of the most common and most harmful misuses of cancer statistics.
The Revised ISS: adding LDH and cytogenetics
By 2015 it was clear that the ISS, for all its virtues, missed important biology. Two patients could share ISS Stage II yet have completely different diseases at the molecular level, and clinicians had learned that certain genetic abnormalities in the myeloma cells carried a much worse prognosis than the blood tests suggested. The International Myeloma Working Group therefore developed the Revised International Staging System, or R-ISS, published by Palumbo and colleagues in the Journal of Clinical Oncology. The R-ISS keeps the ISS as its foundation and adds two more dimensions: serum LDH, classified simply as normal or high relative to the laboratory's upper limit of normal, and high-risk cytogenetic abnormalities detected by interphase fluorescence in situ hybridization, abbreviated iFISH.
The cytogenetics included in the R-ISS are three specific abnormalities: deletion of the short arm of chromosome 17, written del(17p); translocation between chromosomes 4 and 14, written t(4;14); and translocation between chromosomes 14 and 16, written t(14;16). A patient is considered to have high-risk cytogenetics if at least one of these three is present. The deletion of 17p removes the TP53 tumor suppressor region and is the most consistently adverse of the three. The two translocations place powerful enhancers next to growth-promoting genes. LDH, meanwhile, is a marker of rapid cell turnover and aggressive disease; a high LDH suggests the myeloma is proliferating quickly and behaving aggressively. None of these could be read off the old blood tests, which is why they were added.
The R-ISS rules combine the three inputs as follows. R-ISS I requires ISS Stage I together with normal LDH and no high-risk cytogenetics: the patient must be favorable on all three axes. R-ISS III requires ISS Stage III together with either high LDH or high-risk cytogenetics: unfavorable on the ISS axis plus at least one unfavorable biological feature. R-ISS II is everything else, all the mixed patterns in between. In the validation cohort reported in the 2015 paper, the 5-year overall survival was 82 percent for R-ISS I, 62 percent for R-ISS II, and 40 percent for R-ISS III. That 42 percentage point spread between the best and worst groups is what justified the revision: the R-ISS separates patients into risk groups far more cleanly than the ISS alone.
| R-ISS stage | Definition | 5-year overall survival in the validation cohort |
|---|---|---|
| R-ISS I | ISS I AND normal LDH AND no high-risk cytogenetics | 82 percent |
| R-ISS II | All combinations not meeting R-ISS I or R-ISS III | 62 percent |
| R-ISS III | ISS III AND (high LDH OR high-risk cytogenetics) | 40 percent |
Notice the logic of the design. To reach R-ISS I, a patient must clear every hurdle, which makes it a genuinely favorable group, only about one in ten patients in the original data. To reach R-ISS III, a patient must fail the ISS hurdle and fail at least one biological hurdle, which makes it a genuinely high-risk group. Everyone else lands in R-ISS II, which remains the largest and most heterogeneous group. The calculator applies these rules exactly, and it also handles the cases where the cytogenetics are not known, as described below.
How this calculator works
The calculator above takes four inputs and produces two stages. Beta-2 microglobulin and albumin are always required, because the ISS cannot be computed without them. LDH is required for the R-ISS and is entered as a simple normal or high choice against the reporting laboratory's own reference range, which is how the original paper defined it. High-risk cytogenetics is entered as yes, no, or not known. If the iFISH result is not available, the calculator still returns the ISS stage and reports the R-ISS as indeterminate whenever the unknown information could change the answer, explaining why.
The rules of the papers allow the R-ISS to be determined in some cases even when cytogenetics are unknown. An ISS Stage II patient is always R-ISS II, because R-ISS I requires ISS I and R-ISS III requires ISS III, so no cytogenetic result can move such a patient. An ISS Stage I patient with high LDH is R-ISS II regardless of cytogenetics, because R-ISS I demands normal LDH and R-ISS III demands ISS III. And an ISS Stage III patient with high LDH is R-ISS III regardless of cytogenetics, because the LDH alone satisfies the second condition. In every other case with unknown cytogenetics, the calculator declines to assign an R-ISS and says so, because guessing would be worse than admitting uncertainty. These indeterminate cases are the ones to resolve by obtaining the iFISH result.
Limitations you should know
Every staging system is a product of its era, and the ISS and R-ISS are no exception. The ISS median survivals come from patients treated largely before the novel agents transformed myeloma therapy, and the R-ISS validation cohort was assembled during the transition to modern treatment. Both systems still stratify risk correctly today, but the absolute survival figures are historical. Modern combinations including proteasome inhibitors, immunomodulatory drugs and monoclonal antibodies have shifted every stage's outlook upward. The numbers on this page are the published anchors of the systems, not forecasts for patients treated in 2026.
Laboratory measurement adds its own caveats. Beta-2 microglobulin assays differ between laboratories, and the value is sensitive to renal function and to intercurrent illness, as noted above. LDH is only meaningful against the specific laboratory's upper limit of normal, which varies. The iFISH result depends on the technique: the R-ISS was defined with interphase FISH on enriched plasma cells, and results from other methods, or from samples with low plasma cell purity, are not strictly comparable. A stage computed from an unrepresentative sample is a label on unreliable data.
The field has continued to move. In 2022, D'Agostino and colleagues published R2-ISS, a second revision that adds chromosome 1q gain to the abnormalities counted and replaces the three groups with a weighted point score across ISS stage, LDH, del(17p), t(4;14) and 1q gain. R2-ISS further refines risk separation, particularly within the large R-ISS II group. This calculator computes ISS and R-ISS, the pair that remains the most widely reported in practice, and does not compute R2-ISS. The treating hematology team will use whichever system is current at the time of staging.
Finally, the deepest limitation is conceptual. Staging systems describe groups. They cannot see the individual patient: not the patient's age and fitness, not the response to the first cycles of therapy, which is itself one of the strongest prognostic signals in myeloma, not minimal residual disease status, and not the patient's own priorities. A stage is a starting coordinate for a conversation, and the conversation is where medicine happens. This tool supplies the coordinate; it does not and cannot supply the conversation.
Key takeaways
- The International Staging System (ISS), published by Greipp and colleagues in 2005, stages multiple myeloma using two routine blood tests: serum beta-2 microglobulin and serum albumin.
- Beta-2 microglobulin is a protein shed from the surface of nucleated cells, so its level in serum rises with total tumor burden, and it is cleared by the kidneys, so renal impairment from myeloma kidney disease also raises it.
- The ISS uses only beta-2 microglobulin and albumin.
- The R-ISS needs three pieces of information: the ISS stage, the LDH result and the iFISH cytogenetics.
Frequently asked questions
What is the International Staging System for multiple myeloma?
The International Staging System (ISS), published by Greipp and colleagues in 2005, stages multiple myeloma using two routine blood tests: serum beta-2 microglobulin and serum albumin. Stage I means beta-2 microglobulin below 3.5 mg/L with albumin at least 3.5 g/dL. Stage III means beta-2 microglobulin at least 5.5 mg/L. Stage II covers everyone else. In the original cohort of 10,750 patients, median survivals were 62 months for Stage I, 44 months for Stage II, and 29 months for Stage III.
Why do beta-2 microglobulin and albumin predict myeloma prognosis?
Beta-2 microglobulin rises with total tumor burden because it is shed from the surface of myeloma cells, and it also rises when myeloma damages the kidneys, since it is cleared renally. Serum albumin falls with inflammation, poor nutrition and advanced disease, marking how the patient is tolerating the illness. Together they capture the amount of disease and the state of the host, which is why they predicted survival so well in the large development datasets.
What is the difference between ISS and R-ISS?
The ISS uses only beta-2 microglobulin and albumin. The Revised ISS (Palumbo et al., 2015) adds serum LDH, normal versus high, and high-risk cytogenetics by iFISH, specifically del(17p), t(4;14) and t(14;16). R-ISS I requires ISS I plus normal LDH and no high-risk cytogenetics. R-ISS III requires ISS III plus high LDH or high-risk cytogenetics. R-ISS II covers all other combinations. In the validation cohort, 5-year overall survival was 82 percent for R-ISS I, 62 percent for R-ISS II, and 40 percent for R-ISS III.
Why can the R-ISS sometimes not be calculated?
The R-ISS needs the ISS stage, the LDH result and the iFISH cytogenetics. If the cytogenetics are unknown, the stage cannot always be assigned, because a high-risk abnormality would change it. The rules do fix some cases: ISS Stage II is always R-ISS II, an ISS I patient with high LDH is always R-ISS II, and an ISS III patient with high LDH is always R-ISS III. In every other case with unknown cytogenetics, the honest answer is indeterminate until the iFISH result is available.
Do the published survival numbers apply to an individual patient?
No. The ISS median survivals of 62, 44 and 29 months and the R-ISS 5-year overall survival figures of 82, 62 and 40 percent are group averages from the study cohorts, not individual predictions. They describe what happened on average to patients in each stage in those research settings. Individual outcomes depend on treatment, age, fitness, response to therapy and other disease features, and modern therapy has improved on these historical figures.
Has the R-ISS been replaced by R2-ISS?
In 2022 the International Myeloma Working Group published R2-ISS, which adds chromosome 1q gain and uses a weighted point score instead of three simple groups. The original R-ISS remains the version most widely used in practice, which is why this calculator computes ISS and R-ISS. The treating hematology team decides which system to report at the time of staging.
References and further reading
Medical disclaimer
This calculator is for educational and informational purposes only. It is not medical advice, it does not diagnose multiple myeloma or any other condition, it does not predict any individual's outcome, and it does not recommend any treatment. Staging must be performed and interpreted by a qualified hematology clinician as part of a full clinical assessment. If you have concerns about your health, please see a healthcare professional.
Sources
- Greipp PR, San Miguel J, Durie BG, et al. International staging system for multiple myeloma. J Clin Oncol. 2005;23(15):3412-3420. (Source of the ISS definitions: Stage I is beta-2 microglobulin below 3.5 mg/L with albumin at least 3.5 g/dL; Stage III is beta-2 microglobulin at least 5.5 mg/L; Stage II is neither. Median survivals of 62, 44 and 29 months in the 10,750-patient development cohort.)
- Palumbo A, Avet-Loiseau H, Oliva S, et al. Revised International Staging System for multiple myeloma: a report from International Myeloma Working Group. J Clin Oncol. 2015;33(26):2863-2869. (Source of the R-ISS: R-ISS I is ISS I plus normal LDH and no high-risk cytogenetics; R-ISS III is ISS III plus high LDH or high-risk cytogenetics; R-ISS II is all other combinations. High-risk cytogenetics are del(17p), t(4;14) and t(14;16) by iFISH. 5-year overall survival of 82, 62 and 40 percent in the validation cohort.)
- D'Agostino M, Cairns DA, Lahuerta JJ, et al. Second Revision of the International Staging System (R2-ISS) for Overall Survival in Multiple Myeloma: A European Myeloma Network (EMN) Report Within the HARMONY Project. J Clin Oncol. 2022;40(29):3406-3418. (Second revision adding chromosome 1q gain and a weighted point score; not computed by this calculator.)