What is the Charlson Comorbidity Index?
The Charlson Comorbidity Index is a method of classifying comorbidity that was developed by Mary Charlson and colleagues and published in the Journal of Chronic Diseases in 1987. It was designed to solve a practical problem in longitudinal medical research: how to summarize the burden of coexisting disease in a patient so that the effect of comorbidity can be measured, adjusted for, and compared across patients. Rather than counting every diagnosis equally, the index assigns each of 19 conditions a weight of 1, 2, 3 or 6 points, where the weight reflects the condition's adjusted relative risk of one-year mortality. An age adjustment is then added, giving a single number that predicts mortality risk and serves as a compact summary of how sick a patient is beyond their primary diagnosis.
The reason the Charlson index has endured for decades is that comorbidity confounds almost everything in medicine. A study comparing two treatments can be misleading if one treatment group is older or carries more chronic disease. A surgeon judging operative risk needs to know not just what operation is planned but what other illnesses the patient carries into the operating theatre. A prognosis discussion with a patient who has several chronic conditions needs some way of combining those conditions into an overall picture. The Charlson index gives clinicians and researchers a standardized, reproducible way of doing this, and it remains one of the most cited comorbidity measures in the medical literature.
It is worth understanding what the index is and is not. It is a prognostic and risk-adjustment tool, not a diagnostic test and not a treatment guide. A high score does not say which condition should be treated first or which treatment a patient should receive. What it says is that patients with this combination of conditions and this age have, on average, a higher risk of dying within a given period. That information feeds into clinical judgment; it never replaces it.
How the index was developed and validated
The original 1987 study was conducted in two stages. First, the authors examined a cohort of medical inpatients and determined which coexisting conditions were independently associated with one-year mortality, adjusting for age. Conditions with similar relative risks were grouped into the same weight category, producing the now familiar weights of 1, 2, 3 and 6. Second, the resulting weighted index was validated in a separate cohort of patients, where it was shown to predict mortality in a graded fashion: higher scores meant higher risk, in a smooth and reproducible pattern.
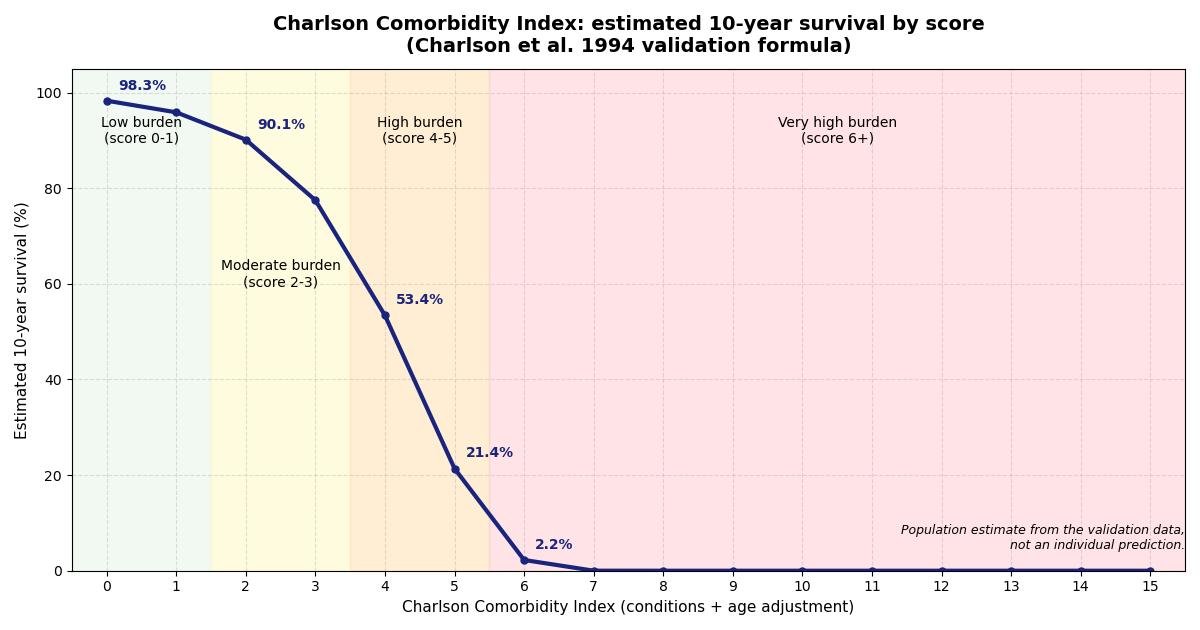
In 1994, Charlson and colleagues published a validation of the combined age and comorbidity index that is the basis of the calculator on this page. That study is the source of the 10-year survival formula used here: the estimated 10-year survival equals 0.983 raised to the power of e raised to the power of 0.9 times the combined score. The formula describes the average survival pattern seen in the validation data, and it is the standard way of converting a Charlson score into an estimated survival probability. Later work, including a widely cited 2011 update by Quan and colleagues that re-estimated the weights using hospital discharge data from six countries, has refined and extended the index, but the original weights and the 1994 survival formula remain the canonical reference points.
The weighted condition table
The heart of the index is its table of 19 conditions and their weights. Ten conditions carry a weight of 1 point each: myocardial infarction, congestive heart failure, peripheral vascular disease, cerebrovascular disease, dementia, chronic pulmonary disease, connective tissue disease, ulcer disease, mild liver disease, and diabetes without end-organ damage. These are the conditions whose adjusted relative risk of one-year mortality was lowest among those included in the index, but they still mattered: each contributes one point, and several together add up. A patient with heart failure, chronic pulmonary disease and uncomplicated diabetes already has 3 comorbidity points before age is considered.
Six conditions carry a weight of 2 points: hemiplegia or paraplegia, moderate or severe renal disease, diabetes with end-organ damage, any tumor without metastasis, leukemia, and lymphoma. The higher weight reflects a stronger independent association with mortality in the development data. Note the careful distinctions the index draws. Diabetes is split: uncomplicated diabetes is weight 1, while diabetes with end-organ damage, meaning damage to the eyes, kidneys or nerves from diabetes, is weight 2. Liver disease is split too: mild liver disease is weight 1, while moderate or severe liver disease is weight 3. And cancer is split: a localized tumor, leukemia or lymphoma is weight 2, while a metastatic solid tumor is weight 6.
Only two conditions carry the maximum weight of 6 points: metastatic solid tumor and AIDS. In the development data these had the strongest association with one-year mortality, roughly six times the baseline risk after adjustment, which is why they anchor the top of the scale. Moderate or severe liver disease stands alone at weight 3, between the two-point conditions and the six-point conditions. The calculator on this page enforces the mutual exclusivity that the original index intends: you choose one diabetes category, one liver disease category and one tumor category, so that a patient is never counted twice for what is really one condition at different levels of severity.
Two features of the table often surprise first-time users. First, the conditions are defined by their presence, not their severity, except where the index explicitly splits categories such as diabetes, liver disease and cancer. A mild heart attack years ago counts the same 1 point as a recent large one; the index deliberately trades fine detail for simplicity and reproducibility. Second, common conditions that strongly affect quality of life but were not independently associated with one-year mortality in the development data, such as hypertension or depression, do not appear in the index at all. The Charlson index was tuned to mortality, and it should not be mistaken for a complete picture of a patient's health.
The age adjustment
Age is such a strong predictor of mortality that the index treats it as a condition in its own right. The age adjustment adds 1 point for each decade of age starting at 50: ages 50 to 59 add 1 point, 60 to 69 add 2 points, 70 to 79 add 3 points, and age 80 and above adds 4 points. Below age 50 no age points are added. The combined score used in the survival formula is the sum of the condition weights and the age adjustment, which is why the 1994 validation described it as a combined age and comorbidity index.
The practical effect is large. An otherwise healthy 75-year-old starts with 3 points before any condition is considered, which means age alone places such a patient near the middle of the risk spectrum. This is not a judgment about the value of older lives; it is simply what the data showed about mortality risk. The age adjustment also explains why the index is mainly used in adults: the weights and the survival formula were derived from adult cohorts.
How this calculator applies the rules
The calculator above implements the published algorithm exactly. You enter the patient's age, which is required, then select the conditions present. The eight weight 1 conditions are individual tick boxes. Diabetes, liver disease and tumor status are each a single choice, which prevents the double counting that would happen if, for example, both mild and severe liver disease could be ticked at once. Hemiplegia, moderate or severe renal disease and AIDS are individual tick boxes. The calculator adds the condition weights and the age points, then applies the 1994 formula to estimate 10-year survival.
The result shows three things: the total Charlson score, the breakdown into condition points and age points, and the estimated 10-year survival as a percentage. The score is also placed in a descriptive burden band: 0 to 1 is described as low burden, 2 to 3 as moderate burden, 4 to 5 as high burden, and 6 or above as very high burden. These bands are descriptive labels used on this page to summarize the number; they are not thresholds from the source papers. The survival estimate is the number to interpret, and it comes directly from the published formula, not from the bands.
What your score means: the 10-year survival estimate
The 10-year survival estimate is computed as 0.983 raised to the power of e raised to the power of 0.9 times the combined score, where e is the base of the natural logarithm, approximately 2.71828. Because the score sits inside an exponent of an exponent, survival falls steeply as the score rises. A score of 0 gives an estimated 10-year survival of about 98 percent. A score of 2 gives about 90 percent. A score of 4 gives about 53 percent. A score of 5 gives about 21 percent, and a score of 6 gives about 2 percent. You can see how quickly the curve bends: each additional point matters more than the last.
Several caveats are essential. First, this is a population estimate, not an individual prediction. It describes the average survival pattern for patients with a given score in the validation setting, and any individual patient may do much better or much worse depending on factors the index does not capture: the severity of each condition, current treatments, functional status, frailty, nutrition, social support, and conditions outside the 19 indexed items. Second, medicine has changed since the validation data were collected, and outcomes for many of the indexed conditions have improved, so the formula may underestimate survival for today's patients. Third, the formula applies to the combined score that includes the age adjustment; computing it from condition points alone would give a wrong, overly optimistic number. Fourth, the estimate is most informative in the middle of the score range; at the extremes it mainly confirms what is already obvious, that very low scores carry low risk and very high scores carry high risk.
Used with these caveats, the estimate is a useful anchor for prognosis discussions and for research risk adjustment. A clinician can use it to give a patient a realistic sense of the scale of risk, to decide how aggressive a workup or treatment plan should be, and to compare outcomes fairly between groups with different comorbidity burdens. What it should never be used for is a decision about whether a patient deserves treatment: a number cannot carry that moral weight, and the index was never designed for it.
Strengths and limitations
The index's strengths explain its longevity. It is simple: 19 conditions, four weights, one age rule, and the score can be computed from routine records in minutes. It is standardized, so a Charlson score of 4 means the same thing in different studies and different hospitals, which makes it valuable for research and for comparing outcomes. It is validated: the graded relationship between score and mortality has been confirmed in many populations beyond the original cohorts. And it is transparent: unlike a black-box prediction model, every point in the score can be traced to a specific condition or to the patient's age.
The limitations are equally real and should shape how the score is used. The index captures whether a condition is present but not how severe it is, so two patients with the same score can be in very different clinical states. It omits conditions that matter greatly to patients, such as depression, chronic pain and hypertension, because they were not mortality predictors in the development data. The weights reflect mortality risk in the 1980s, and the relative lethality of conditions has shifted with modern treatment, which is why updated weights such as those of Quan and colleagues exist. The index says nothing about function, cognition beyond dementia, or quality of life, so it complements but never replaces a full clinical assessment. Finally, scores derived from administrative data, such as hospital coding, can miss conditions that were present but not coded, which biases scores downward in research that relies on records alone.
The honest way to use the Charlson index is as a starting point. It quantifies one important dimension of a patient's situation, the mortality-weighted burden of diagnosed comorbidity, and it does so reproducibly. The clinician then adds everything the index leaves out: severity, trajectory, patient priorities, and the human judgment that no score can supply. This calculator gives you the reproducible part; the rest remains the work of the clinician and the patient together.
Key takeaways
- The Charlson Comorbidity Index is a method of classifying comorbidity, developed by Charlson and colleagues in 1987.
- Each of 19 conditions present contributes its published weight: 10 conditions count 1 point, 5 count 2 points, moderate or severe liver disease counts 3 points, and metastatic solid tumor or AIDS count 6 points each.
- A score of 5 reflects a substantial comorbidity burden.
- The age-adjusted Charlson index adds 1 point for each decade of age starting at 50: ages 50 to 59 add 1 point, 60 to 69 add 2 points, 70 to 79 add 3 points, and age 80 and above adds 4 points.
Frequently asked questions
What is the Charlson Comorbidity Index?
The Charlson Comorbidity Index is a method of classifying comorbidity developed by Charlson and colleagues in 1987. It assigns weights of 1, 2, 3 or 6 points to 19 medical conditions according to their adjusted relative risk of one-year mortality, then adds an age adjustment. The total predicts mortality risk and is widely used for risk adjustment in research and for prognosis in clinical practice.
How is the Charlson score calculated?
Each condition present contributes its published weight: ten conditions count 1 point, five count 2 points, moderate or severe liver disease counts 3 points, and metastatic solid tumor or AIDS count 6 points each. The age adjustment adds 1 point per decade from age 50 (50 to 59: 1, 60 to 69: 2, 70 to 79: 3, 80 and above: 4). Condition points and age points are added together for the combined score.
What does a Charlson score of 5 mean?
A score of 5 reflects a substantial comorbidity burden. Using the published 10-year survival formula from Charlson et al. 1994, which is 0.983 raised to the power of e raised to 0.9 times the score, a score of 5 gives an estimated 10-year survival of about 21 percent. This is a population estimate from the validation data, not a prediction for any individual patient.
What is the age adjustment in the Charlson index?
The age-adjusted Charlson index adds 1 point for each decade of age starting at 50. Ages 50 to 59 add 1 point, 60 to 69 add 2 points, 70 to 79 add 3 points, and age 80 and above adds 4 points. Under age 50 no age points are added. The adjustment reflects the strong effect of age on mortality independent of diagnosed conditions.
Is the 10-year survival estimate accurate for an individual?
It is a population-level estimate, not an individual prediction. The formula comes from a validation study and describes the average survival pattern for patients with a given score in that research setting. It does not account for disease severity, treatment, frailty, or conditions outside the 19 indexed conditions, so an individual patient can differ greatly from the estimate.
How does the Charlson index differ from the Elixhauser index?
The Charlson index uses 19 weighted conditions summed into a single score with an age adjustment, and was designed to predict mortality. The Elixhauser index uses a broader set of about 30 comorbidity categories without weights and was designed for risk adjustment of hospital outcomes such as length of stay and in-hospital mortality. Both are comorbidity classification systems used in health services research.
Medical disclaimer
This calculator is for educational and informational purposes only. It is not medical advice, it does not diagnose any condition, and it does not predict any individual's outcome. A Charlson Comorbidity Index score should be interpreted by a qualified clinician as part of a full assessment. If you have concerns about your health, please see a healthcare professional.
Sources
- Charlson ME, Pompei P, Ales KL, MacKenzie CR. A new method of classifying prognostic comorbidity in longitudinal studies: development and validation. J Chronic Dis. 1987;40(6):473-483. (Source of the 19-condition weighted table used in this calculator.)
- Charlson ME, Szatrowski TP, Peterson J, Gold J. Validation of a combined comorbidity index. J Clin Epidemiol. 1994;47(11):1245-1251. (Source of the combined age and comorbidity score and the 10-year survival formula: survival = 0.983 raised to the power of e raised to 0.9 times the score.)
- Quan H, Li B, Couris CM, et al. Updating and validating the Charlson comorbidity index and score for risk adjustment in hospital discharge abstracts using data from 6 countries. Am J Epidemiol. 2011;173(6):676-682. (Later re-estimation of the weights; the original weights remain the canonical reference used here.)