Why cancer patients are especially prone to blood clots
Blood clots in the veins, called venous thromboembolism (VTE), are far more common in people with cancer than in the general population. A clot that forms in a deep leg or arm vein is called deep vein thrombosis (DVT); if part of it breaks off and travels to the lungs it becomes a pulmonary embolism (PE), which can be fatal. In their 2008 paper, Khorana and colleagues noted that venous thromboembolism is the second leading cause of death in patients with cancer, which shows why this complication deserves the same attention as the tumour itself.
The explanation goes back to the three ingredients of clot formation that physicians learn as Virchow's triad: blood that clots too easily, blood that moves too slowly, and blood vessels whose lining is injured. Cancer supplies all three. Many tumours release tissue factor and other procoagulant substances that switch the clotting system on. Tumours can also press on veins or reduce mobility, slowing venous blood flow. Finally, chemotherapy itself injures the lining of blood vessels, and the central venous catheters used to deliver treatment provide a surface on which clots can start. Because the patients in the Khorana study were all receiving chemotherapy, the score estimates clotting risk in exactly that setting: ambulatory patients living at home while on treatment.
A symptomatic clot during chemotherapy matters beyond the immediate danger. It often means an emergency visit or hospital admission, interruption or delay of cancer treatment, and the start of blood-thinning therapy that must be balanced against the bleeding risks of a low platelet count or an invasive tumour. Preventing clots is therefore valuable, but preventive blood thinners carry their own risks, so clinicians need a way to identify which ambulatory patients are most likely to benefit. That is the gap the Khorana score was designed to fill.
What the Khorana score is
The Khorana score is a five-factor risk model for chemotherapy-associated thrombosis, published by Khorana AA, Kuderer NM, Culakova E, Lyman GH and Francis CW in the journal Blood in 2008, in the paper "Development and validation of a predictive model for chemotherapy-associated thrombosis" (volume 111, pages 4902 to 4907). The authors developed the model in a derivation cohort of 2,701 ambulatory patients with cancer who were starting a new chemotherapy regimen, selecting the predictive variables from a larger set of candidate clinical and laboratory measurements. They then tested the finished model in a separate, independent validation cohort of 1,365 patients.
The outcome the model predicts is symptomatic venous thromboembolism, meaning DVT or PE that caused symptoms and came to medical attention, over a median follow-up of about two and a half months. A deliberate design choice was that every input is something routinely available before chemotherapy begins: the cancer site, three standard blood test results, whether an erythropoiesis-stimulating agent is being used, and height and weight. No imaging, no specialised clotting tests, and no waiting for expensive biomarkers are required, which is why the score can be calculated at the bedside or in the clinic in a minute or two.
The five risk factors, explained
1. Site of cancer: 0, 1 or 2 points
The primary cancer site is the only factor that can contribute two points, which reflects how strongly certain tumour types drive clotting. Cancers of the stomach and the pancreas are classified as very high risk and score 2 points. Lung cancer, lymphoma, gynecologic cancers, bladder cancer and testicular cancer are classified as high risk and score 1 point. All other cancer sites score 0. This ranking is not a judgement about the cancer's seriousness in general; it specifically reflects the observed VTE rates by site in the study data. Pancreatic cancer is the classic example: pancreatic tumours are notorious producers of tissue factor, and pancreatic cancer patients have among the highest clot rates of any solid tumour.
2. Platelet count of 350 x10⁹/L or higher: 1 point
A pre-chemotherapy platelet count at or above 350 x10⁹/L (350,000 per microlitre) adds 1 point. Cancer often drives platelet production upward through inflammatory cytokines, a pattern called reactive thrombocytosis, and platelets are central building blocks of any thrombus. The count used must be the pre-chemotherapy value, because chemotherapy frequently suppresses platelet counts once treatment starts, so a later measurement does not represent the risk the model was built on.
3. Hemoglobin below 10 g/dL or use of erythropoiesis-stimulating agents: 1 point
A pre-chemotherapy hemoglobin level below 10 g/dL adds 1 point, and so does current use of an erythropoiesis-stimulating agent (ESA), the medicines used to raise red cell counts. Crucially, these are alternatives, not additions: a patient with low hemoglobin who is also receiving an ESA still scores only 1 point for this factor, not 2. Anemia in this setting often marks more advanced disease or greater inflammatory burden. ESA use counts even when the hemoglobin is above 10 g/dL because these agents have themselves been associated with thrombotic risk, so the model treats their use as carrying the same weight as anemia.
4. Leukocyte count above 11 x10⁹/L: 1 point
A pre-chemotherapy leukocyte (white blood cell) count above 11 x10⁹/L adds 1 point. Like thrombocytosis, leukocytosis in cancer usually reflects an inflammatory response driven by the tumour. Activated white cells interact with platelets and the vessel wall in ways that promote clotting, which is why this simple, universally available laboratory value earned a place in the model.
5. Body mass index of 35 kg/m² or higher: 1 point
A body mass index at or above 35 kg/m² adds 1 point. Obesity is an established independent risk factor for venous thromboembolism in the general population as well as in cancer, through mechanisms including venous stasis, chronic inflammation and altered clotting factor levels. This calculator computes your BMI automatically from the height and weight you enter, so you do not need to calculate it yourself; the 35 threshold corresponds to class II obesity and above.
How the score is calculated and what each band means
Add the points from the five factors to get a total between 0 and 6. The total places the patient in one of three risk bands:
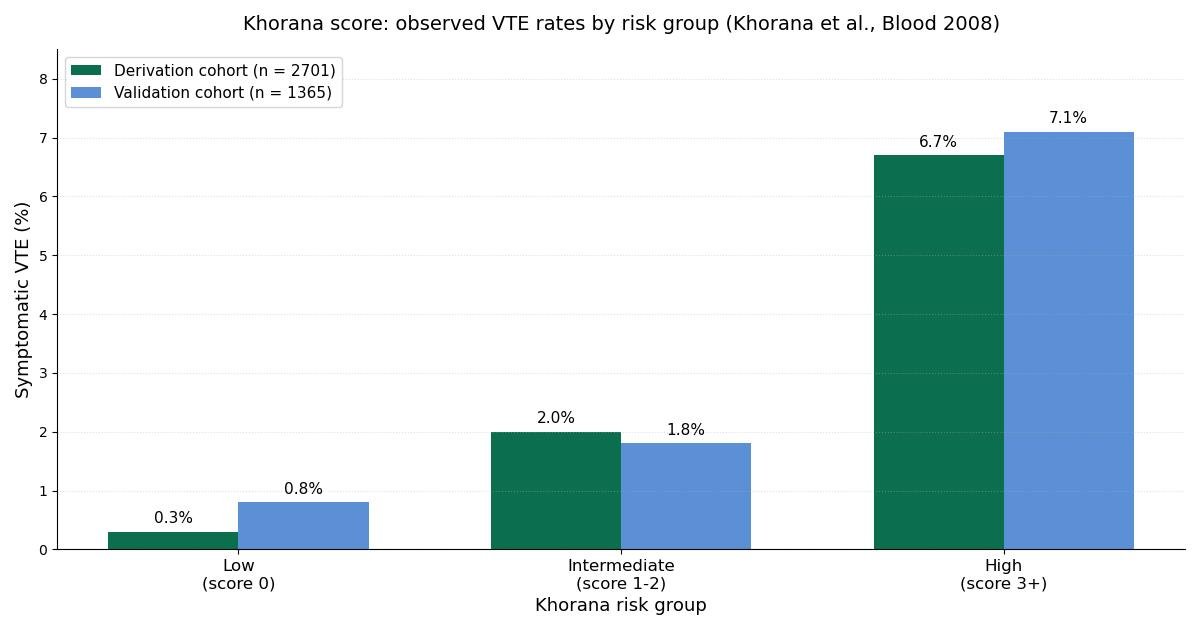
- 0 points: low risk. Symptomatic VTE occurred in 0.3 percent of this group in the derivation cohort and 0.8 percent in the validation cohort.
- 1 to 2 points: intermediate risk. Symptomatic VTE occurred in 2.0 percent of this group in the derivation cohort and 1.8 percent in the validation cohort.
- 3 or more points: high risk. Symptomatic VTE occurred in 6.7 percent of this group in the derivation cohort and 7.1 percent in the validation cohort.
The intermediate band contains the majority of patients, which is an important practical point: most ambulatory chemotherapy patients land at 1 or 2 points. The score is ordinal, so one should read risk from the observed rates for each band rather than assuming each extra point adds a fixed amount of risk. Two patients can share the same total through completely different combinations of factors, for example a pancreatic cancer alone (2 points) versus a lung cancer with a high platelet count (1 plus 1 points), and the model treats those totals the same.
What the study found, in detail
The consistency between the two cohorts is the core evidence for the score. In the derivation cohort of 2,701 patients, the observed rates of symptomatic VTE were 0.3 percent for low risk, 2.0 percent for intermediate risk and 6.7 percent for high risk. In the independent validation cohort of 1,365 patients, the corresponding rates were 0.8 percent, 1.8 percent and 7.1 percent. The risk bands separated patients similarly in both groups, which is what validation is meant to demonstrate: the model was not just fitted to the quirks of one dataset.
Two cautions belong with these numbers. First, the follow-up was short, a median of about two and a half months, so these percentages describe early chemotherapy-associated clots; longer follow-up would show higher cumulative rates. Second, these are observed event frequencies in the study populations, not personalised predictions. A patient in the high-risk band does not have a 7 percent destiny, and a patient in the low-risk band is not immune: the rates describe what happened to groups of similar patients in the research setting.
The score of 2 and the question of preventive treatment
The original model defines high risk as 3 or more points. Yet in clinical practice, guidelines on cancer-associated thrombosis from bodies such as ASCO and ISTH reference a Khorana score of 2 or more as the threshold at which clinicians may discuss thromboprophylaxis with ambulatory patients receiving chemotherapy. The reasoning is pragmatic: within the broad intermediate band of 1 to 2, patients scoring 2 sit closer to the high-risk group, and trials of preventive therapy have enrolled patients at this threshold.
Whether to offer preventive treatment is a clinical decision that weighs the clot risk against bleeding risk, the type of chemotherapy, other medications, platelet counts during treatment, and the patient's preferences. The Khorana score informs only the clot-risk side of that balance; it says nothing about bleeding risk, which must be assessed separately. This page describes the evidence and the guideline context but does not recommend any specific medicine, and no calculator can replace that conversation with the treating oncology team.
Limitations: who the score does not cover
Every prediction model is only as good as its fit to the population it was built in, and the Khorana score has clear boundaries. It was derived for ambulatory patients receiving chemotherapy. It was not developed or validated for patients already admitted to hospital, for patients receiving palliative or hospice care only, or for cancer patients not receiving chemotherapy, and using it in those settings applies the model outside the population in which it was tested.
The model also leaves out several known clot risk factors: a previous history of VTE, prolonged immobility, recent surgery, the presence of a central venous catheter, and laboratory markers such as D-dimer all influence risk but are not part of the five factors. The score dates from the mid-2000s chemotherapy era, so its behaviour in patients receiving modern immunotherapies or targeted agents deserves the same cautious interpretation given to any older model applied to newer treatments. Finally, the BMI threshold of 35 kg/m² is a high bar that misses patients who are overweight or mildly obese, and the short follow-up means the published rates should not be projected far beyond the first months of treatment.
How to use this calculator
Select the primary cancer site from the grouped list, enter the pre-chemotherapy platelet count, hemoglobin level and leukocyte count, indicate whether an erythropoiesis-stimulating agent is being used, and enter height and weight so the BMI can be computed. Press the calculate button to see the total score, the risk band, a factor-by-factor breakdown of the points, and the observed VTE rates from both the derivation and validation cohorts of the original study. The result panel also notes when the score reaches the guideline-referenced threshold of 2 or more, purely as context for discussion with a clinician. All computation happens in your browser; nothing you enter is sent anywhere.