What the P/F ratio measures
The P/F ratio, sometimes written PaO2/FiO2, is the standard bedside measure of how efficiently the lungs transfer oxygen into the blood. It is calculated from two numbers that almost every ventilated patient has recorded: the arterial oxygen tension (PaO2), measured in mmHg on an arterial blood gas, and the fraction of inspired oxygen (FiO2), the concentration of oxygen the patient is breathing, expressed as a fraction between 0.21 (room air) and 1.0 (pure oxygen).
Dividing the first by the second gives a single number that describes oxygenation failure in a way that accounts for how much oxygen support the patient is receiving. A healthy person breathing room air typically shows a high ratio, while a patient whose lungs are failing will show a low one. The ratio is used in intensive care units worldwide to grade the severity of hypoxaemia, to standardise descriptions of acute respiratory distress syndrome (ARDS), and to track whether a patient is improving or deteriorating over hours and days.
The P/F ratio does not measure the cause of hypoxaemia, only its severity relative to the oxygen being given. It is one of the most quoted numbers in critical care, and understanding exactly what it does and does not say is essential before using it.
Why dividing by FiO2 matters
Consider why the division is necessary. A PaO2 of 80 mmHg sounds acceptable in isolation, but its meaning depends entirely on the oxygen concentration that produced it. On room air (FiO2 0.21), a PaO2 of 80 gives a ratio of about 381, which reflects reasonably functioning lungs. The same PaO2 of 80 in a patient receiving 80% oxygen (FiO2 0.80) gives a ratio of 100, which indicates severe oxygenation failure. The blood gas number was identical; the clinical situations could hardly be more different.
This is the whole point of normalising by FiO2. Without the division, comparing PaO2 values between patients, or in the same patient across the day as oxygen is titrated up or down, is meaningless. The ratio answers the question clinicians actually need answered: given how much oxygen this patient is being given, how well are the lungs doing their job? A falling ratio means the lungs are contributing less; a rising ratio means oxygenation is improving relative to the support provided.
It also explains why the ratio must be recalculated whenever the FiO2 changes. A patient whose PaO2 stays at 90 while the FiO2 is weaned from 0.60 to 0.40 has improved (the ratio moved from 150 to 225), even though the blood gas looks unchanged. Trending the ratio rather than the raw PaO2 is standard practice for this reason.
The formula and a worked example
The formula is straightforward:
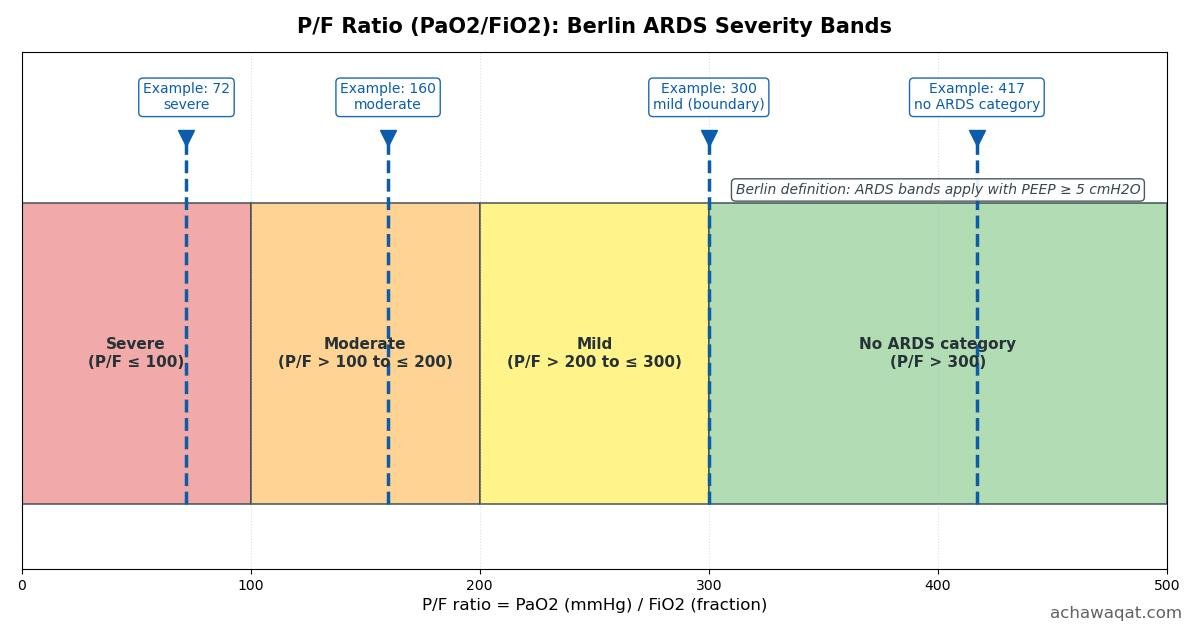
FiO2 must be entered as a fraction, not a percent: 50% oxygen is 0.50, 100% oxygen is 1.0, and room air is 0.21. The result is conventionally rounded to the nearest whole number. Worked example: a patient with PaO2 80 mmHg on FiO2 0.50 has a P/F ratio of 80 / 0.50 = 160. Under the Berlin bands described below, 160 falls in the moderate range.
If your blood gas analyser reports PaO2 in kPa, convert to mmHg first by multiplying by 7.50062. A PaO2 of 10.7 kPa is about 80 mmHg, giving the same ratio of 160 on FiO2 0.50. Mixing units, for instance dividing a kPa value by the FiO2 fraction, produces a number roughly 7.5 times too small and a falsely alarming severity band, so confirming units is the single most important step before interpreting the result.
Because the formula divides by FiO2, a FiO2 of zero is not a valid input: division by zero is undefined, and a zero FiO2 has no physiological meaning. The calculator above rejects non-positive and missing values with named errors rather than computing a misleading number.
The Berlin definition and its severity bands
The modern framework for ARDS is the Berlin definition, published by the ARDS Definition Task Force in 2012 (JAMA 2012;307(23):2526-33). It grades ARDS severity by the P/F ratio measured with a minimum positive end-expiratory pressure (PEEP) of 5 cmH2O. The bands are:
| P/F ratio | Berlin category |
|---|---|
| Above 300 | No ARDS category (with ventilatory support) |
| Above 200 up to and including 300 | Mild |
| Above 100 up to and including 200 | Moderate |
| 100 or below | Severe |
Note the boundary behaviour: a ratio of exactly 300 is mild, exactly 200 is moderate, and exactly 100 is severe, because each band includes its lower boundary. These bands standardise language across units and trials: saying a patient has moderate ARDS by Berlin criteria tells any clinician that the P/F ratio sits between 100 and 200 on adequate PEEP, which is far more precise than descriptive labels.
Crucially, the P/F ratio is only one of the Berlin criteria, and a low value alone never diagnoses ARDS. The full definition requires all of the following. First, timing: respiratory symptoms must begin or worsen within one week of a known clinical insult. Second, chest imaging: bilateral opacities on radiograph or CT that are not fully explained by effusions, lobar or lung collapse, or nodules. Third, origin of oedema: the respiratory failure must not be fully explained by cardiac failure or fluid overload, with objective assessment such as echocardiography to exclude hydrostatic oedema when no ARDS risk factor is present. Fourth, oxygenation: the P/F ratio bands above, measured with a minimum PEEP of 5 cmH2O, with the mild category also satisfiable on non-invasive ventilation with CPAP of at least 5 cmH2O. Without all four, the label ARDS does not apply, whatever the ratio says.
PEEP dependence: the same ratio means different things on different PEEP
The Berlin requirement of at least 5 cmH2O PEEP exists because the P/F ratio is not a pure property of the lung: it moves with the ventilator settings. Raising PEEP recruits collapsed alveoli and can lift the ratio without any real change in the underlying injury, while lowering PEEP can drop it. A ratio of 180 measured on PEEP 5 and the same ratio measured on PEEP 14 describe different clinical situations, even though the number is identical.
This has two practical consequences. First, the ratio should always be interpreted and documented alongside the PEEP at the time of measurement; a bare number without its ventilator context is incomplete. Second, trends are only comparable when measured on similar settings. A ratio that rises after a PEEP increase may reflect recruitment rather than recovery, and a ratio that falls after a deliberate PEEP reduction during weaning may not signal deterioration. Experienced clinicians therefore read the ratio, the PEEP and the trajectory together, never the ratio in isolation.
It also means the ratio has a limitation built into its design: unlike the oxygenation index, it does not account for the pressure cost of achieving the measured oxygenation. Two patients can share a P/F ratio of 150 while one needs a PEEP of 6 and the other a PEEP of 16. The ratio treats them as equivalent; the clinician should not.
Altitude correction
At altitude, the lower barometric pressure reduces the driving pressure for oxygenation, so a P/F ratio measured in a mountain hospital is not directly comparable to one measured at sea level. The Berlin definition addresses this explicitly: when the altitude is higher than 1000 metres, the ratio should be corrected by multiplying by the barometric pressure divided by 760.
For example, a measured ratio of 200 at a barometric pressure of 600 mmHg corrects to 200 x (600 / 760), which is about 158, shifting the interpretation from the mild band into the moderate band. Failing to correct at altitude understates severity. Most intensive care units operate near sea level and never need this step, but units above 1000 metres should apply it routinely and document both the measured and the corrected value.
The S/F ratio: a pulse oximetry surrogate
When no arterial blood gas is available, the SpO2/FiO2 (S/F) ratio offers a non-invasive estimate. It divides the pulse oximetry saturation (as a percent) by the FiO2 fraction: an SpO2 of 94% on FiO2 0.60 gives 94 / 0.60, which is about 157. Pandharipande and colleagues derived and validated this surrogate against the P/F ratio for the respiratory component of the SOFA score (Crit Care Med 2009;37(4):1317-21), with approximate equivalents of 315 for the mild threshold, 235 for the moderate threshold and 144 for the severe threshold.
The S/F ratio is useful for screening and for trending in settings where arterial sampling is impractical, but it is less validated than the P/F ratio and carries the weaknesses of the oximeter. Pulse oximetry becomes unreliable at very low saturations, and saturations at or near 100% sit on the flat top of the oxyhaemoglobin dissociation curve, where large changes in PaO2 produce almost no change in SpO2: a patient can deteriorate significantly while the S/F ratio barely moves. Poor peripheral perfusion, motion artefact and abnormal haemoglobins can also distort readings. Treat the S/F ratio as a screening and trending tool, and confirm important decisions with an arterial blood gas.
What a low P/F ratio does not tell you: the differential
A low ratio announces that oxygenation is failing; it says nothing about why. The differential for a falling P/F ratio is broad, and management differs completely between its entries. Pneumonia and ARDS impair gas exchange through shunt and inflammation. Cardiogenic pulmonary oedema floods alveoli because of raised left-sided pressures, and its treatment is diuresis and afterload management, not lung-protective ventilation strategies aimed at ARDS. Pulmonary embolism creates dead space and ventilation-perfusion mismatch. Atelectasis, mucus plugging, pleural effusions and pneumothorax each have their own fixes.
This is why the Berlin definition insists on excluding cardiac failure and fluid overload before ARDS can be diagnosed, and why the ratio is a trigger for investigation rather than a diagnosis. A new low ratio should prompt the same questions every time: is this new, what changed on the ventilator, what does the chest imaging show, what do the haemodynamics and fluid balance say, and is there a reversible cause such as a blocked airway or a displaced tube? The number starts the search; it never ends it.
How clinicians use the P/F ratio
In practice, the ratio serves three purposes. The first is severity grading at the bedside: placing the patient in a Berlin band sets expectations and guides the intensity of monitoring and support. The second is trending: a ratio tracked over hours on comparable settings shows whether interventions such as PEEP titration, recruitment manoeuvres or prone positioning are working, and whether the lung injury is progressing despite them.
The third is standardisation for research and referral. Clinical trials of ARDS therapies enrol and stratify patients using the Berlin bands, so documenting the ratio in Berlin terms connects the bedside to the evidence base. When a patient is discussed with a referral centre, for instance for consideration of extracorporeal support, the receiving team will ask for the ratio with its FiO2, PEEP, timing and trend, not just the latest number. A well-documented series of ratios, each paired with its ventilator settings, is the currency of those conversations.
Limitations of the P/F ratio
Several limitations deserve explicit mention. The ratio is a snapshot: a single value can be distorted by transient events such as recent suctioning, a ventilator circuit disconnection, agitation or a recent change in settings, so it should be measured at a reasonable steady state and trended rather than acted on alone. PaO2 itself is influenced by factors outside the lung, including cardiac output, haemoglobin concentration and metabolic demand, so identical lung injury can produce different ratios in different patients.
The ratio also assumes the FiO2 is accurate. On a ventilator this is usually reliable, but on non-invasive support, high-flow nasal oxygen or simple oxygen masks the delivered FiO2 is approximate and varies with the patient's breathing pattern, which makes the ratio approximate too. Finally, as noted above, the ratio ignores the pressure cost of oxygenation and cannot distinguish shunt from ventilation-perfusion mismatch, so it complements rather than replaces clinical assessment, imaging and blood gas analysis.
A clinician tool, not a home triage test
The P/F ratio belongs at the bedside of a monitored patient, interpreted by clinicians who can see the patient, the ventilator and the trend. It cannot be computed meaningfully at home: it requires an arterial blood gas and a known FiO2, and its bands were defined for patients receiving ventilatory support. If you are a patient or relative reading this page, the useful message is simpler: the care team tracks numbers like the P/F ratio to grade how much support the lungs need, and questions about what the numbers mean for a specific person belong in a conversation with that team, not with a calculator.
For clinicians, the ratio is one instrument among many. Use it to grade severity in Berlin terms, to trend response to therapy on comparable settings, to correct for altitude where relevant, and to document the case for escalation or referral. Pair it with the examination, the imaging, the haemodynamics and the trajectory over hours, and it earns its place as one of the most practical numbers in respiratory critical care.