What the Epworth Sleepiness Scale is
The Epworth Sleepiness Scale, universally abbreviated ESS, is the most widely used questionnaire for measuring daytime sleepiness. It was developed by Dr Murray Johns, a sleep physician at Epworth Hospital in Melbourne, Australia, and published in the journal Sleep in 1991. Johns wanted a simple, standardised way to capture something clinicians had previously judged by impression alone: a person's general level of daytime sleepiness, meaning their average tendency to fall asleep when the opportunity arises in ordinary life. The instrument is deliberately short. It asks about eight situations that most people encounter in daily life, and for each the respondent rates the chance of dozing off on a four-point scale. The eight item scores are added together, giving a single total between 0 and 24. Higher totals mean a stronger propensity to fall asleep during the day.
The original validation study enrolled 180 people: 30 normal controls and 150 patients with a variety of sleep disorders. The results showed that the scale cleanly separated the groups. Normal controls averaged 5.9 with a modal score of 6, and there was no meaningful difference between men and women. Patients with disorders known to cause excessive daytime sleepiness scored dramatically higher, and an analysis of variance across the diagnostic groups was highly significant. Since then the ESS has been translated into many languages and used in thousands of published studies, becoming the standard first-line screening instrument whenever daytime sleepiness is in question, from primary care and occupational health to sleep clinics and clinical trials. The scale itself remains under the copyright of M.W. Johns (1990-97), and Johns recommended preserving the exact wording of the eight items so that results remain comparable with the published evidence base, which this page does.
The eight situations, explained
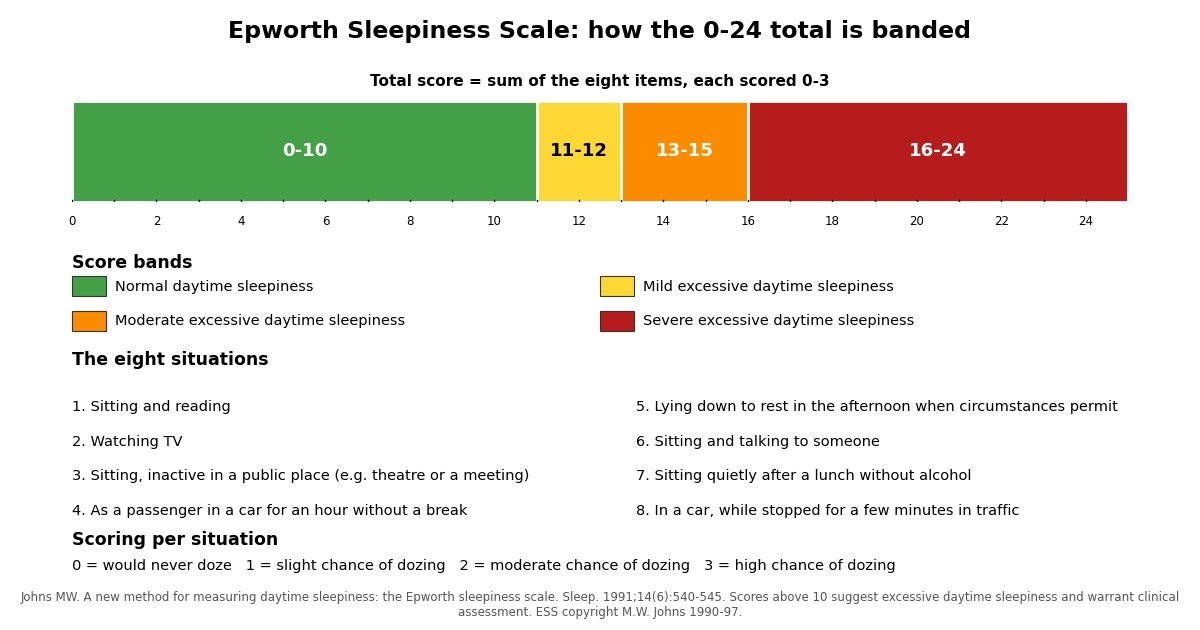
The eight situations were chosen to span a gradient of soporific potential, from highly soporific to barely soporific, so that the total reflects sleepiness across the whole range of daily life. Each is scored 0 (would never doze), 1 (slight chance of dozing), 2 (moderate chance of dozing), or 3 (high chance of dozing).
1. Sitting and reading
Reading while seated is a quiet, low-stimulation activity, and most people who are not sleepy can do it indefinitely without dozing. A high score here suggests that even modestly engaging passive activities are not enough to keep you awake.
2. Watching TV
Television watching is the classic evening soporific: dim light, a comfortable seat, and passive attention. Many healthy adults report at least a slight chance of dozing here, which is why it sits near the middle of the scale's sensitivity.
3. Sitting, inactive in a public place (e.g. theatre or a meeting)
This item tests sleepiness in a socially demanding setting. Most alert people stay awake in a meeting or theatre out of engagement and social pressure, so dozing here signals a stronger sleep drive than dozing on the sofa.
4. As a passenger in a car for an hour without a break
Being a passenger removes the alerting effect of driving itself. An hour of monotonous motion in a warm car is soporific for many people, and this item separates ordinary drowsiness on long journeys from pathological sleepiness.
5. Lying down to rest in the afternoon when circumstances permit
This is the most soporific item on the scale: lying down in the afternoon, when the post-lunch dip in alertness is at its deepest. In the original study, 94 percent of normal controls reported at least some likelihood of dozing here, so a score of 0 on this item is actually unusual and worth noting.
6. Sitting and talking to someone
Conversation is an active, socially engaging task, and dozing during it is highly abnormal. In Johns's study, 96 percent of patients with narcolepsy or idiopathic hypersomnia reported some chance of dozing while sitting and talking to someone, compared with only 6 percent of controls. A score above 0 here is one of the strongest single-item signals on the scale.
7. Sitting quietly after a lunch without alcohol
The post-lunch dip is a normal circadian phenomenon, and the item deliberately excludes alcohol so that the answer reflects sleepiness rather than the sedating effect of a drink. Some afternoon drowsiness is normal; a high chance of actually falling asleep is not.
8. In a car, while stopped for a few minutes in traffic
This is the least soporific situation on the scale and functions as a severity marker. Dozing while driving, even when stopped briefly in traffic, indicates severe daytime sleepiness and an immediate safety concern. Like item 6, it was one of the two items that best separated patients with narcolepsy and idiopathic hypersomnia from controls in the original study.
Scoring and the interpretation bands
The ESS total is the simple sum of the eight item scores, so it ranges from 0 (no chance of dozing in any situation) to 24 (a high chance of dozing in all eight). The bands below are the standard clinical interpretation, and the widely used threshold for excessive daytime sleepiness is a total above 10.
| Total score | Band | What it means |
|---|---|---|
| 0-5 | Lower normal | Low end of the normal range for daytime sleepiness. |
| 6-10 | Higher normal | Upper end of the normal range; still considered normal daytime sleepiness. |
| 11-12 | Mild excessive daytime sleepiness | Above the normal range; warrants attention to sleep habits and, if persistent, clinical discussion. |
| 13-15 | Moderate excessive daytime sleepiness | Clearly abnormal sleepiness; clinical evaluation is recommended. |
| 16-24 | Severe excessive daytime sleepiness | Profound sleepiness that impairs safety and daily function; prompt clinical evaluation is recommended. |
The 0-10 band is the normal range used in clinical practice, and the split into lower normal (0-5) and higher normal (6-10) is a common refinement that reflects where most healthy adults fall. In the original study, the control group's average of 5.9 sits near the middle of the normal range. The critical cut point is 10: totals of 11 and above are taken to indicate excessive daytime sleepiness, the symptom that sleep clinicians investigate. It is worth stressing that these bands describe severity of a symptom, not a diagnosis. Two people can both score 14 for entirely different reasons, and the band alone says nothing about which reason applies.
What the ESS actually measures: sleep propensity, not fatigue
The most misunderstood thing about the Epworth scale is what it is actually measuring. It does not measure tiredness, fatigue, exhaustion, or how unrefreshed you feel in the morning. It measures sleep propensity: the likelihood that you will actually fall asleep when given a quiet opportunity. These are related but distinct experiences. Many people feel exhausted yet lie awake at night, and many people who fall asleep effortlessly in meetings do not describe themselves as feeling tired. The scale's wording is precise on this point: it asks about the chance of dozing or falling asleep, in contrast to just feeling tired.
The original study demonstrated the distinction elegantly. Patients with persistent insomnia, who are by definition tired and sleep-deprived, scored lower than healthy controls, averaging 2.2 against 5.9. If the scale measured fatigue, insomniacs would have scored highest; instead they scored lowest, because their problem is an inability to fall asleep, not an excess of it. Conversely, ordinary sleep deprivation raises ESS scores: a week of short nights will push the total upward even in someone with no sleep disorder at all. This is why the instructions ask about your usual way of life in recent times. A score taken during an unusually sleep-deprived fortnight, for example with a new baby or during shift work, may overstate your typical sleepiness, and repeating the scale when life returns to normal is sensible before drawing conclusions.
Subjective self-report versus objective testing
The ESS is a subjective instrument: it records your own estimate of your dozing tendency. Its objective counterpart in sleep medicine is the Multiple Sleep Latency Test, or MSLT. During an MSLT you spend a day in a sleep laboratory and are given several scheduled nap opportunities in a dark, quiet room; the test measures how many minutes elapse before you fall asleep on each occasion. Short sleep latencies indicate objectively measurable sleepiness, and the MSLT is the standard investigation when narcolepsy or unexplained hypersomnia is suspected. Overnight polysomnography, the full sleep study, plays a different role again: it records brain waves, breathing, oxygen levels, and limb movements through the night to identify what is disrupting sleep, such as apnoeas or periodic limb movements.
Subjective and objective measures do not always agree, and the disagreement itself can be informative. Some people underestimate their sleepiness, particularly when chronic sleep restriction has become their normal, and score lower on the ESS than their MSLT would suggest. Others overestimate it, scoring high while objective testing shows normal alertness. Neither instrument is the whole truth on its own. In clinical practice the ESS serves as the accessible front door: cheap, instant, and repeatable, it identifies who needs the expensive overnight and daytime laboratory studies, and it provides a simple number for tracking whether treatment is working.
The ESS in sleep apnoea and narcolepsy
Two disorders account for most clinical use of the Epworth scale: obstructive sleep apnoea and narcolepsy. In the original 1991 study, the ESS rose in step with apnoea severity. Patients with mild obstructive sleep apnoea (a respiratory disturbance index of 5 to 24.9 events per hour) averaged 11.0, those with moderate apnoea (25 to 49.9) averaged 13.0, and those with severe apnoea (50 or more) averaged 16.2. The correlation with the respiratory disturbance index was one of the study's key findings, and it established the ESS as a useful severity marker in sleep apnoea clinics, where it is routinely repeated to judge the effect of treatment such as continuous positive airway pressure.
Narcolepsy produced the highest scores of all. Patients with narcolepsy averaged 17.5 and those with idiopathic hypersomnia 17.9, both firmly in the severe band. The two most discriminating items were sitting and talking to someone and being stopped in traffic: 96 percent of patients in these groups reported at least some chance of dozing in those situations, against only 6 percent of controls. It is important to keep the direction of this evidence straight. High ESS scores are characteristic of narcolepsy, but a high score does not mean narcolepsy is present: sleep apnoea, chronic sleep deprivation, depression, and several medications can all push the total into the same range. The scale flags the symptom; the sleep laboratory identifies the disease.
Limitations
The ESS has well documented limitations, and honest use of the scale means knowing them. First, it is subjective, so it is vulnerable to the usual biases of self-report: people misremember, minimise, or exaggerate, and cultural attitudes toward napping and dozing vary. Second, the eight situations assume a particular lifestyle. Someone who neither drives nor attends meetings must estimate rather than report, which introduces guesswork. Third, the scale does not distinguish causes. Sleep deprivation, depression, medication side effects, and genuine sleep disorders can produce identical totals. Fourth, individual items carry different weight in practice even though they contribute equally to the total: a 3 on sitting and talking to someone means something very different from a 3 on lying down in the afternoon. Finally, the ESS is a screening and tracking instrument, not a diagnostic test. It cannot diagnose sleep apnoea, narcolepsy, or any other disorder, and it should never be the sole basis for treatment decisions such as driving restrictions. Those decisions belong to a clinician with the full clinical picture.