Six-Minute Walk Distance Calculator
In short: Free six-minute walk distance calculator: predicted 6MWD from the Enright and Sherrill 1998 reference equations (age, sex, height, weight), lower limit of normal, percent of predicted, and what your distance means. Includes a worked example, test protocol, and FAQs. Use the calculator above, then read the guide below to interpret your result and its limitations.
Predicted six-minute walk distance (6MWD) from the Enright and Sherrill 1998 reference equations. Enter age, sex, height, and weight to get the predicted distance and its lower limit of normal; add the distance you actually walked to get the percent of predicted and see whether the result falls below the normal range. Equations verified against the source paper on 2026-10-05. Medically reviewed by Dr. Taimoor Asghar.
Calculator
The reference equations are sex-specific; a prediction is not possible without this.
The equations were derived in adults aged 40 to 80; ages outside that range are flagged as extrapolations.
The distance you actually walked in six minutes, if you have done the test. Used for the percent of predicted and the comparison against the lower limit of normal.
What the six-minute walk test measures
The six-minute walk test (6MWT) is a simple field test of functional exercise capacity: the total distance a person can walk, at their own pace, on a flat hard surface in six minutes. Unlike maximal cardiopulmonary exercise testing, which pushes the patient toward exhaustion on a bicycle or treadmill while measuring oxygen uptake, the walk test is submaximal and self-paced. The patient chooses the speed, may slow down or stop and rest, then resumes, and the distance covered reflects the integrated response of the lungs, the heart, the circulation, the blood, and the muscles during an activity that resembles ordinary life. That is the test's main strength. Climbing stairs, shopping, and walking to the bus are all submaximal activities, so the distance walked in six minutes correlates with what a person can actually do outside the clinic better than a maximal test does. The test is cheap, needs only a corridor and a stopwatch, and has become one of the most widely used measures of functional status in chronic respiratory disease, heart failure, and pulmonary hypertension. The result is the six-minute walk distance, abbreviated 6MWD, reported in metres.
How the test is done: the ATS 2002 standardized protocol
The American Thoracic Society published standardized guidelines for the test in 2002, specifically to make results comparable between clinics and between studies. The corridor must be 30 metres long, straight, flat, and rarely travelled, with cones or marks at each turnaround point. The patient is told to walk as far as possible for six minutes, back and forth along the corridor, at their own pace, and that they may slow down, stop, and rest as necessary, then resume walking when they are ready. During the walk the administrator uses standardized encouragement phrases at each minute mark, because encouragement measurably changes the distance walked. Pulse rate and blood oxygen saturation are usually recorded, and the patient rates breathlessness and fatigue on the Borg scale before and after the walk. There is a well documented learning effect: the second walk is usually longer than the first, so a practice walk is recommended in research settings. Standardizing these details matters because the factors below change the distance by tens of metres, which is enough to cross clinical thresholds such as the BODE index bands described later on this page.
The reference equations: Enright and Sherrill 1998
To interpret a measured distance you need to know what a healthy person of the same age, sex, height, and weight would walk. The most widely cited reference equations come from Enright and Sherrill, published in 1998 in the American Journal of Respiratory and Critical Care Medicine. They administered the standardized test to 117 healthy men and 173 healthy women, aged 40 to 80 years, in Tucson, Arizona, and built sex-specific regression equations that explained about 40 percent of the variation in the distance walked. The median distance in that population was 576 m for men and 494 m for women.
| Sex | Equation (distance in metres) | Lower limit of normal |
|---|---|---|
| Men | (7.57 x height in cm) - (5.02 x age) - (1.76 x weight in kg) - 309 | Predicted - 153 |
| Women | (2.11 x height in cm) - (2.29 x weight in kg) - (5.78 x age) + 667 | Predicted - 139 |
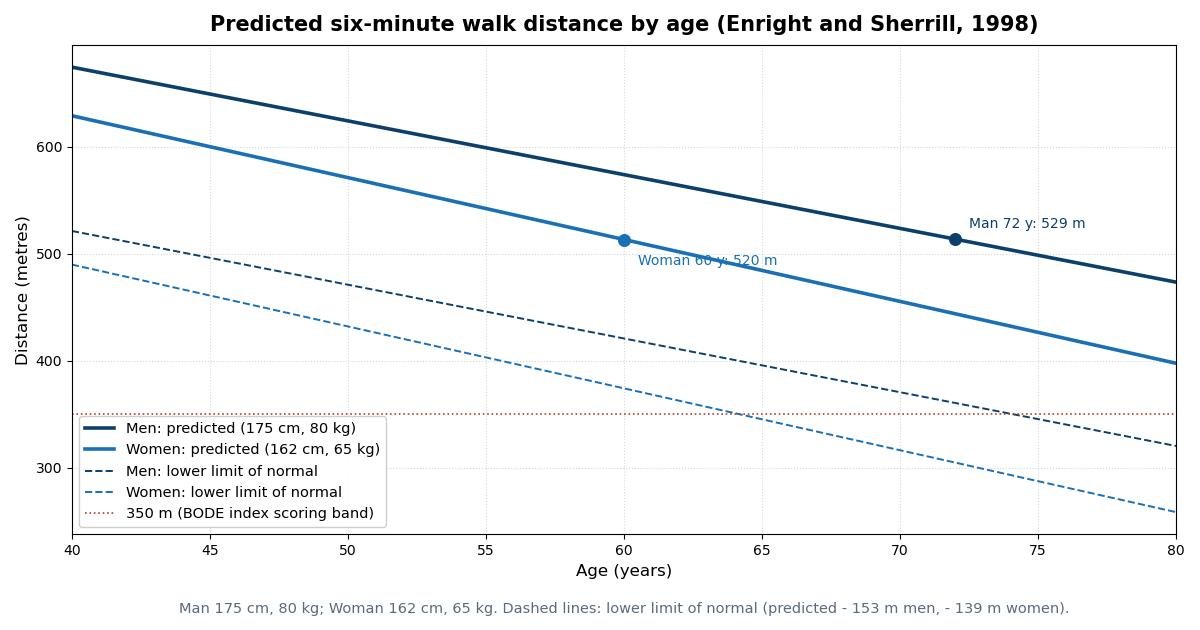
Each coefficient has a physical meaning. Height enters positively because longer legs take longer steps. Age enters negatively because distance falls with age. Weight enters negatively because a heavier body does more mechanical work per metre walked. Notice that the coefficients differ between the sexes: in men the age coefficient (5.02 m per year) dominates, while in women the height coefficient (2.11) is small, which is why the two lines in the chart below have different slopes. These are regression coefficients fitted to one specific population, not laws of physiology, and that is exactly why the calculator flags ages outside the 40 to 80 year derivation range as extrapolations.
A worked example keeps the arithmetic honest. Take a 72-year-old man, 177 cm tall, weighing 80 kg: (7.57 x 177) = 1339.89, minus (5.02 x 72) = 361.44, minus (1.76 x 80) = 140.80, minus 309, giving 528.65 m, about 529 m. His lower limit of normal is 528.65 - 153 = 375.65 m. Take a 60-year-old woman, 165 cm, 65 kg: (2.11 x 165) = 348.15, minus (2.29 x 65) = 148.85, minus (5.78 x 60) = 346.80, plus 667, giving 519.50 m, about 520 m. Her lower limit of normal is 519.50 - 139 = 380.50 m. The calculator follows exactly these steps, and both worked examples are part of its automated test suite. The chart below plots the predicted distance against age for both sexes at fixed height and weight, with the lower limits of normal as dashed lines and the two worked-example points marked.
Reading your result: predicted, lower limit of normal, percent of predicted
The calculator reports the predicted distance: the expected distance for a healthy person with your age, sex, height, and weight. It also reports the lower limit of normal (LLN): the predicted distance minus 153 m for men or 139 m for women. The LLN is the boundary below which a result is considered abnormally low. If you also enter the distance you actually walked, the calculator reports the percent of predicted (measured divided by predicted, times 100) and tells you whether the measured result sits at or above the LLN, which is within the reference range, or below it, which is abnormal by the Enright and Sherrill reference standard. Two points of interpretation matter. First, a result between the LLN and the predicted value is within the reference range but below average; it is not abnormal, but it may still be worth watching over time. Second, "abnormal" does not name a disease. Many different conditions shorten the walking distance, from lung disease and heart failure to anemia, arthritis, and simple deconditioning, so a low result is a pointer for clinical assessment, not a diagnosis. Percent of predicted is useful for tracking one patient over time, but only when every repeat test uses the same corridor, the same encouragement, and the same conditions.
What the distance means: functional capacity and prognosis
In chronic obstructive pulmonary disease (COPD) the six-minute walk distance is a recognized prognostic marker. The BODE index, a validated multidimensional tool for predicting mortality in COPD developed by Celli and colleagues in 2004, scores the 6MWD in bands: 350 m or more scores 0 points, 250 to 349 m scores 1 point, 150 to 249 m scores 2 points, and 149 m or less scores 3 points, combined with body mass index, the degree of airflow obstruction, and the dyspnea score. Large cohort studies have shown that shorter distances predict hospitalization and death in COPD and in heart failure, independent of other measures. The distance also tracks rehabilitation: it rises after pulmonary rehabilitation programs, which is one of the reasons the test is repeated during treatment. Two caveats keep the numbers honest. First, the smallest change that patients can actually perceive has been estimated at about 54 m in chronic lung disease (Redelmeier and colleagues, 1997), while larger cohort work linked a decline of 30 m or more over a year to higher mortality in COPD (the ECLIPSE cohort, Polkey and colleagues, 2013). Use these as context for trends in a single patient measured under identical conditions, not as personal targets. Second, the distance is only one dimension of functional capacity. It does not measure strength, balance, or the reason a person stopped walking, and two patients with the same distance can be limited by completely different problems.
Factors that change the distance
The ATS guidelines list a long set of influences, and anyone comparing two results must hold them constant. A shorter corridor, with more turnarounds, shortens the distance. Standardized encouragement adds metres compared with walking in silence. Supplemental oxygen lengthens the distance in patients who desaturate. The learning effect makes the second attempt longer than the first. Age, sex, height, and weight are handled by the reference equation, but motivation, pain, orthopaedic problems, cognitive impairment, and sedating or heart-rate-slowing medications are not, and each can shorten the distance. Clothing and footwear matter a little; altitude matters through lower oxygen availability; a recent meal, the time of day, and whether the patient used their usual walking aid all play a part. Comparing distances measured under different conditions is one of the commonest misuses of the test, and it is the main reason the ATS wrote the guidelines in the first place. When you repeat the test to follow a trend, repeat everything: the corridor, the instructions, the encouragement, and the timing.
Limitations you should know
The equations are only as good as their derivation population: healthy adults aged 40 to 80 in one American city, explaining only about 40 percent of the variance. That means 60 percent of the variation between individuals is not captured by age, sex, height, and weight, so two people with identical inputs can legitimately differ by a hundred metres or more. Reference equations from other populations, including Brazilian, Chilean, and Portuguese cohorts, give different predictions, which is why the ATS encouraged population-specific equations. The Enright and Sherrill equations are not validated for children, for adults under 40 or over 80, for very tall or very short stature, or for highly trained athletes: the calculator flags those inputs explicitly rather than silently extrapolating. The equations also assume the standardized 30 m protocol. Distances walked on treadmills, in shorter corridors, or with non-standard encouragement are not directly comparable with these predictions. Finally, the lower limit of normal is a statistical boundary, not a biological cliff. A result a few metres below it in a patient who feels well is far less concerning than the same number in a patient with worsening breathlessness, and clinical judgment always outranks the arithmetic.
When clinicians use the test
The test appears wherever functional capacity guides decisions. Before lung surgery it helps judge operative risk. In pulmonary rehabilitation it measures the response to training. In heart failure clinics it is a prognostic marker followed over years. In pulmonary hypertension the distance is a standard trial endpoint. In COPD it sits inside the BODE index alongside body mass, obstruction, and dyspnea. It is also used to titrate supplemental oxygen and to follow chronic disease between visits. In each setting the value comes from comparing the patient with their own previous results under identical conditions, with the reference equation supplying the population context. For a related bedside assessment of gas exchange during exertion or at rest, see the A-a oxygen gradient calculator, and for more tools visit the pulmonology calculator index.
Sources
Equations, coefficients, and derivation population verified against: (1) Enright PL, Sherrill DL. Reference equations for the six-minute walk in healthy adults. Am J Respir Crit Care Med. 1998;158(5 Pt 1):1384-1387. 117 healthy men and 173 healthy women aged 40 to 80; median 6MWD 576 m (men), 494 m (women); equations explained about 40% of variance. https://www.semanticscholar.org/paper/Reference-equations-for-the-six-minute-walk-in-Enright-Sherrill/1b8328dcc14142c3340540e75d003fe4d07ba91f; (2) ATS Committee on Proficiency Standards for Clinical Pulmonary Function Laboratories. ATS statement: guidelines for the six-minute walk test. Am J Respir Crit Care Med. 2002;166(1):111-117 (30 m corridor, standardized encouragement each minute, practice walk effect, factors affecting distance); (3) Celli BR, Cote CG, Marin JM, et al. The body-mass index, airflow obstruction, dyspnea, and exercise capacity index in chronic obstructive pulmonary disease. N Engl J Med. 2004;350:1005-1012 (BODE 6MWD scoring bands: 350 or more 0 points, 250-349 1 point, 150-249 2 points, 149 or less 3 points); (4) Redelmeier DA, Bayoumi AM, Goldstein RS, Guyatt GH. Interpreting small differences in functional status: the Six Minute Walk test in chronic lung disease patients. Am J Respir Crit Care Med. 1997;155(4):1278-1282 (minimal perceptible change about 54 m); (5) Polkey MI, Spruit MA, Edwards LD, et al. on behalf of the ECLIPSE investigators. Predicting outcomes from 6-minute walk distance in chronic obstructive pulmonary disease. J Am Med Dir Assoc. 2012;13:291-297 (a decline of 30 m or more over a year associated with higher mortality in COPD).
Key takeaways
- There is no single number, because the expected distance depends on age, sex, height, and weight.
- It means the walking distance is abnormally low for the person's age, sex, height, and weight by the Enright and Sherrill reference standard.
- The American Thoracic Society 2002 guidelines standardize the test: a 30 metre straight flat corridor with turnaround markers, the patient walking back and forth at their own pace for six minutes, allowed to slow down or rest as needed.
- The six-minute walk test has a well documented learning effect: patients walk further on their second attempt because they pace themselves better and feel more confident with the turns.
Frequently asked questions
What counts as a normal six-minute walk distance?
There is no single number, because the expected distance depends on age, sex, height, and weight. The standard approach uses a reference equation, most often the Enright and Sherrill 1998 equations, to compute the predicted distance for a healthy person with the same characteristics, and compares the measured distance against the lower limit of normal (predicted minus 153 m for men, 139 m for women). A result at or above that limit is within the reference range.
What does a result below the lower limit of normal mean?
It means the walking distance is abnormally low for the person's age, sex, height, and weight by the Enright and Sherrill reference standard. Many different conditions can shorten the distance, including lung disease, heart failure, anemia, musculoskeletal problems, and deconditioning, so a low result is a pointer for clinical assessment rather than a diagnosis of any particular disease.
How is the six-minute walk test actually done?
The American Thoracic Society 2002 guidelines standardize the test: a 30 metre straight flat corridor with turnaround markers, the patient walking back and forth at their own pace for six minutes, allowed to slow down or rest as needed. The administrator gives standardized encouragement phrases at each minute mark. Pulse and oxygen saturation are usually recorded, and breathlessness and fatigue are rated on the Borg scale before and after.
Why is the second walk usually longer than the first?
The six-minute walk test has a well documented learning effect: patients walk further on their second attempt because they pace themselves better and feel more confident with the turns. The ATS 2002 guidelines note this practice effect and recommend a practice walk in research settings, where comparing results between studies depends on standardized conditions.
How big a change in distance is clinically important?
Estimates vary with the population and the question asked. The classic estimate from Redelmeier and colleagues (1997) is about 54 m as the smallest change patients with chronic lung disease can perceive. Larger cohort work (ECLIPSE, Polkey and colleagues, 2013) linked a decline of 30 m or more over a year to higher mortality in COPD. Treat these as context for trends in a single patient measured under identical conditions, not as personal targets.
Can these equations be used for children or young athletes?
No. The Enright and Sherrill equations were derived in healthy adults aged 40 to 80 years and are not validated for children, young adults under 40, people over 80, or very tall or very short stature. The calculator flags ages outside 40 to 80 as extrapolations. Separate reference equations exist for children and for other populations.
References and further reading
Medical disclaimer. This calculator is an educational tool, not medical advice. The predicted six-minute walk distance and its reference limits must be interpreted together with the full clinical picture by a qualified clinician. Do not use it to diagnose, treat, or make decisions about any medical condition. If you have unexplained breathlessness or a marked decline in exercise tolerance, seek medical care.