Predicted Peak Expiratory Flow (PEF) Calculator
In short: Free predicted peak flow calculator using the verified Nunn and Gregg (1989) reference equations: enter age, sex and height to get your expected peak expiratory flow in L/min, compare a measured reading as percent predicted, and see your asthma action-plan zone (green, yellow or red). Use the calculator above, then read the guide below to interpret your result and its limitations.
Enter age, sex and height to get your predicted peak expiratory flow in litres per minute, computed with the verified Nunn and Gregg (1989) reference equations for adults and the Godfrey height-based equation for children. Optionally enter a measured reading to see it as percent of predicted with your green, yellow or red asthma action-plan zone. Medically reviewed by Dr. Taimoor Asghar. Equations verified 2026-10-05 against the sources listed at the bottom of the page.
Compute your predicted peak flow
Required: age, sex, height. Optional: a measured PEF reading to compare against the prediction. Adults (15 to 85) use the Nunn and Gregg equations; children (5 to 14) use the Godfrey equation.
Educational tool only: it applies published reference equations to the values entered. It does not diagnose, and a low reading with symptoms needs prompt medical assessment.
What peak expiratory flow measures
Peak expiratory flow, usually shortened to PEF or peak flow, is the maximum speed at which you can force air out of your lungs, expressed in litres per minute. A small spring-loaded meter captures it: you take one full breath in and blast it out through the mouthpiece, and a sliding marker stops at the fastest point of the exhalation. The number is a direct readout of how open your large airways are. Wide airways let the air rush out fast; narrowed, inflamed airways choke the flow and the number falls.
That simple property makes PEF one of the oldest and most widely used numbers in respiratory medicine. It is central to asthma care: it helps confirm the diagnosis (by showing bronchodilator reversibility or wide day-to-day variability over two weeks), it grades the severity of an attack, and it is the main number patients track at home to monitor how well their treatment plan is working. It can pick up airway narrowing before symptoms appear, which is why asthma action plans are written in terms of PEF zones rather than symptoms alone. COPD patients also use it, though its role there is smaller than in asthma.
PEF correlates reasonably well with the forced expiratory volume in one second (FEV1) measured by spirometry, but it is not a substitute for it. Spirometry measures the whole forced exhalation with precision under supervision; a peak flow meter measures only the single fastest instant, and the result depends on your effort and technique. That is why three blows are taken and the best is kept: the best blow is the closest to what your airways can truly do, while the weaker blows usually reflect effort or technique rather than the disease.
How to take a peak flow reading properly
Bad technique is the commonest cause of a misleadingly low reading, so the routine is worth learning exactly. Meters differ in detail, but the standard steps are the same everywhere:
- Slide the marker to the bottom of the numbered scale, the zero end.
- Stand up straight, or sit fully upright if you cannot stand. Posture changes the number, so use the same position every time.
- Breathe in as deeply as you can, filling your lungs completely.
- Seal your lips firmly around the mouthpiece and hold it horizontal, keeping your tongue clear of it.
- Blow out as hard and as fast as you can in one short, sharp burst, as if blowing out birthday candles. The blow should be over in about a second.
- Note the number where the marker stopped, slide the marker back to zero, and repeat twice more.
- Record the highest of the three numbers. That is your reading.
A few discipline rules keep readings comparable over time. Use the same meter every time, because meters differ slightly. Measure at similar times of day, ideally morning and evening, and note whether you blew before or after your reliever inhaler, since a reliever temporarily raises the number. Never blow during a coughing fit and expect a fair number. And write the readings down or keep them in an app: the pattern across days matters far more than any single number, and your clinician will want to see the diary, not your memory of it.
How the predicted value is calculated
The predicted PEF is the value a healthy person of your age, sex and height would be expected to blow. The calculator above uses the reference equations of Nunn and Gregg, published in the British Medical Journal in 1989 (volume 298, pages 1068 to 1070). They remain the standard reference in much of Europe and are the basis of the EU EN 13826 standard scale fitted to most modern peak flow meters sold in Europe.
Unlike older straight-line rules, these equations are curvilinear: peak flow rises through adolescence into early adulthood, reaches its maximum around age 30 to 35, and then declines steadily with age. The regression captures that rise and fall with a combination of the natural logarithm of age and a linear age term, plus a height term, all exponentiated back to litres per minute.
| Group | Equation (PEF in litres per minute) | Valid ages |
|---|---|---|
| Adult men | PEF = exp( 0.544 x ln(age) - 0.0151 x age - 74.7 / height(cm) + 5.48 ) | 15 to 85 years |
| Adult women | PEF = exp( 0.376 x ln(age) - 0.0120 x age - 58.8 / height(cm) + 5.63 ) | 15 to 85 years |
| Children 5 to 14 | PEF = ((height in cm - 100) x 5) + 100 (Godfrey) | 5 to 14 years |
The Nunn and Gregg equations were fitted to 225 men and 228 women in the United Kingdom who were lifelong non-smokers and met strict criteria of normality. That population matters, because it defines what the prediction means: it is the expected value for a healthy non-smoker of European background. Smokers, people with chronic lung disease, and populations of different ancestry were not the reference group, so the predicted number is a comparison anchor, not a personal verdict. The equations also assume you are using a meter on the EU scale; older Wright-scale meters read differently and should not be mixed with these predictions.
For children aged 5 to 14 the calculator switches to the Godfrey height-based equation, which needs only height. In growing children age and height move together so closely that a height-only equation performs well, and it has the practical advantage that a parent measuring a child needs no age adjustment. Note that it ignores sex: in pre-pubertal children the difference between boys and girls is small enough that the single equation serves for both.
The traffic-light zones and your asthma action plan
A measured reading means little on its own; it gains meaning against a reference. Divide your measured reading by your predicted (or your personal best) and multiply by 100 to get percent of predicted. That percentage is then read on the three-zone traffic-light system used by the British Thoracic Society and the Global Initiative for Asthma:
- Green zone, 80 to 100 percent: airways are open and asthma is under good control. Continue your usual management plan and keep taking preventer medication as prescribed.
- Yellow zone, 50 to 79 percent: caution. Airway narrowing is occurring. Follow your written asthma action plan, which usually means extra doses of your reliever inhaler, and contact your doctor if readings do not recover.
- Red zone, below 50 percent: medical emergency. The airways are severely narrowed. Take rescue medication, call emergency services, and go to the nearest emergency department without delay.
The zones are designed to turn a number into an action, which is why written asthma action plans express instructions in zone language ("if your peak flow falls into the yellow zone, do X"). One practical point is easy to miss: the zones are calculated against your personal best once you have established one, and only against the predicted value before that. Your personal best is the highest reading you can achieve when your asthma is stable and under control; because individual airways vary, it often sits above or below the population prediction, and it is the better reference for day-to-day decisions. The calculator above shows the zones against the predicted value, which is the correct reference for someone newly diagnosed or never monitored.
Why variability matters as much as the number itself
Asthma is a disease of variation: airways that are open in the evening may be tight the next morning. Morning dipping, where the lowest reading of the day comes after waking, is the classic pattern. A single good reading at the clinic can therefore miss asthma entirely, while two weeks of morning and evening readings reveal it. This is why diagnosis guidelines ask for diurnal variability, not just one number.
There are several ways to compute variability, but one widely used method is simple: subtract the lowest reading from the highest, divide by the highest, and multiply by 100. Readings of 300 and 400 L/min, for example, give (400 - 300) / 400 x 100 = 25 percent variability. In several clinical protocols, a variability of 15 percent or more across two weeks of twice-daily readings supports a diagnosis of asthma. To measure it properly, record the best of three blows each morning and each evening, before any reliever medication, and keep the full two-week diary for your clinician.
The same arithmetic is used to judge bronchodilator reversibility, the other pillar of asthma diagnosis: a reading taken before a reliever inhaler is compared with one taken 15 minutes after, and a clear rise supports reversible airway obstruction. In both cases the percentage change, not the raw numbers, carries the diagnostic weight.
Worked examples
Two adult examples show how the numbers move. Take a 30-year-old man who is 175 cm tall. Plugging into the male equation: 0.544 x ln(30) - 0.0151 x 30 - 74.7 / 175 + 5.48 gives about 6.4504, and exp(6.4504) is about 633 L/min. That is his predicted value. If he blows 480, that is 480 / 633 x 100 = 75.8 percent of predicted, which sits in the yellow zone: caution, and his action plan applies.
Take a 25-year-old woman who is 167 cm tall. The female equation gives 0.376 x ln(25) - 0.0120 x 25 - 58.8 / 167 + 5.63, about 6.1882, and exp(6.1882) is about 487 L/min. A blow of 450 is 92.4 percent of predicted, comfortably green. A child example: a 10-year-old who is 140 cm tall uses the Godfrey equation, ((140 - 100) x 5) + 100 = 300 L/min, regardless of sex.
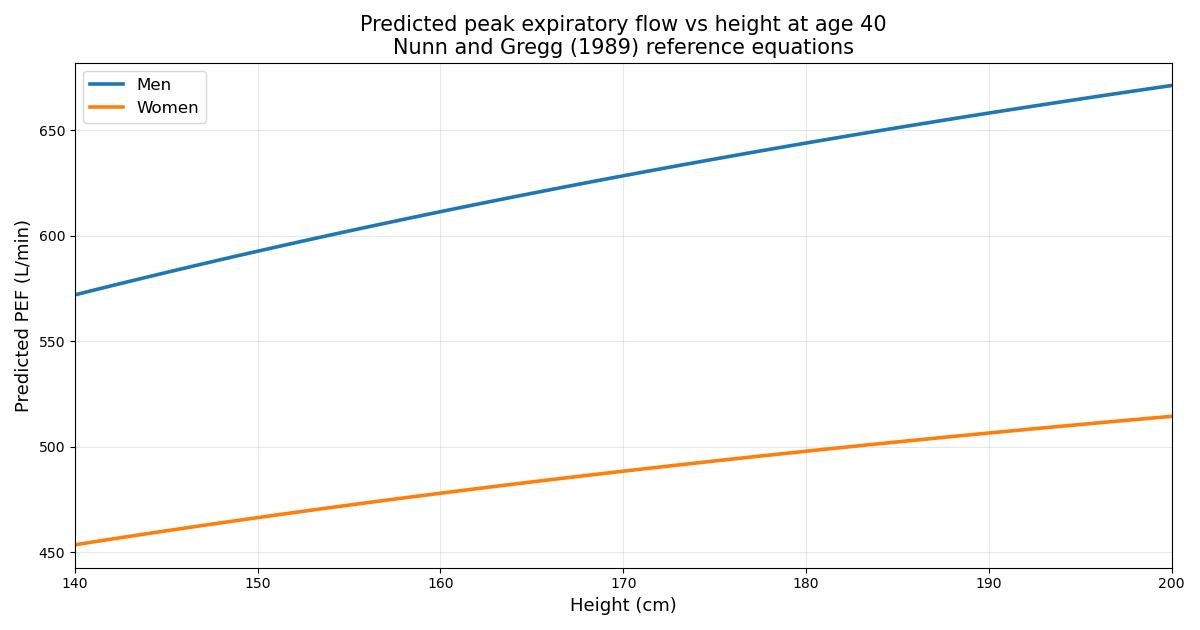
The chart below plots the predicted values against height for both sexes at age 40, showing the steady rise of predicted PEF with height and the gap between the male and female curves at every height.
Limitations you should know
Every reference equation has a population behind it, and this one is no exception. Nunn and Gregg studied healthy lifelong non-smokers in the United Kingdom, and the effect of ethnicity was not evaluated in their analysis. Applying the equations to populations of non-European ancestry, or to people at the extremes of height, pushes beyond the data they were fitted to: tall, short, very young adult, and elderly patients should treat the prediction as approximate. The calculator warns when an adult height falls below 140 cm or above 200 cm for exactly this reason.
The meter scale matters too. The equations underpin the EU EN 13826 scale used on modern European meters. Older Wright-scale meters give different readings, and a Wright reading compared against a Nunn and Gregg prediction is a category error. If you inherited an old meter, check which scale it uses before trusting any comparison.
Technique and effort dominate single readings. A half-hearted blow, a cough mid-blow, a meter held at the wrong angle, or measuring right after a reliever puff can each move the number by tens of litres per minute. That is why the best of three blows is the reading, and why trends and variability beat any single value for decisions. Finally, the prediction is a population average, not a personal ceiling: many healthy people blow well above or below their predicted value, which is why guidelines switch to personal best as the reference as soon as one is established.
Sources and verification
The equations and interpretation bands on this page were verified on 2026-10-05 against: Medical Algorithms: Equations of Nunn and Gregg for predicting PEF in adults (the exact log-based regression equations for men and women, the 15 to 85 age range, the lifelong non-smoker selection criterion, and the stated limitation that the effect of race was not evaluated); OnlyCalculators: Peak Flow Calculator (the Nunn and Gregg equations, the 225 men and 228 women sample, the EU EN 13826 standard scale, the curvilinear age pattern peaking around 30 to 35, the Godfrey pediatric equation for ages 5 to 14, and the BTS/GINA green 80-100, yellow 50-79, red below 50 zones); and Hospital-level adult guidelines: PEF rates annexure (the variability method of (highest - lowest) / highest x 100, with 15 percent or more supporting asthma). The original paper is Nunn AJH, Gregg I. New regression equations for predicting peak expiratory flow in adults. Br Med J 1989;298:1068-70. No statistics, quotations, or thresholds on this page come from uncited sources.
Key takeaways
- Peak expiratory flow (PEF) is the fastest speed, in litres per minute, at which you can blow air out of your lungs in one hard breath.
- Slide the marker to the bottom of the scale and stand up straight, or sit upright if standing is not possible.
- For adults aged 15 to 85 it uses the Nunn and Gregg (1989) regression equations, published in the British Medical Journal (298:1068-70).
- The three zones are the standard asthma action-plan system used by the British Thoracic Society and the Global Initiative for Asthma.
Frequently asked questions
What is peak expiratory flow and why does it matter?
Peak expiratory flow (PEF) is the fastest speed, in litres per minute, at which you can blow air out of your lungs in one hard breath. It is a direct reflection of how open your large airways are: when they narrow, as in an asthma flare or worsening COPD, the number falls. Because it is measured at home with a cheap hand-held meter, it is the main day-to-day monitoring number in asthma care, used to spot deterioration early and to judge whether treatment is working.
How do I take an accurate peak flow reading?
Slide the marker to the bottom of the scale and stand up straight, or sit upright if standing is not possible. Breathe in as deeply as you can, seal your lips around the mouthpiece, and blast the air out in one short, hard burst, as if blowing out birthday candles. Record the number, reset the marker, and repeat twice more. Your reading is the highest of the three blows, not the average. Use the same meter, at similar times of day, and blow before using a reliever inhaler if that is what your action plan asks for.
Which equation does this calculator use, and who was it tested on?
For adults aged 15 to 85 it uses the Nunn and Gregg (1989) regression equations, published in the British Medical Journal (298:1068-70). They were fitted to 225 men and 228 women in the United Kingdom who were lifelong non-smokers meeting strict criteria of normality, and they form the basis of the EU EN 13826 standard scale used on most modern European peak flow meters. For children aged 5 to 14 it uses the Godfrey height-based equation, PEF = ((height in cm - 100) x 5) + 100. Neither equation was adjusted for ethnicity, so apply them cautiously outside the population studied.
What do the green, yellow and red zones mean?
The three zones are the standard asthma action-plan system used by the British Thoracic Society and the Global Initiative for Asthma. Green (80 to 100 percent of predicted or personal best) means airways are open and asthma is under control, so continue the usual plan. Yellow (50 to 79 percent) means airway narrowing is occurring: follow your written asthma action plan, which usually means extra reliever puffs, and contact your doctor if readings do not recover. Red (below 50 percent) is a medical emergency: take rescue medication, call emergency services, and go to the nearest emergency department without delay.
What is peak flow variability, and how is it calculated?
Peak flow variability measures how much your readings swing across the day, and wide swings are a hallmark of asthma. One standard method is: subtract the lowest reading from the highest, divide by the highest, and multiply by 100. For example, readings of 300 and 400 give (400 - 300) / 400 x 100 = 25 percent. In several clinical protocols, a variability of 15 percent or more over two weeks of twice-daily readings supports a diagnosis of asthma. To measure it properly you need the best of three blows each morning and evening, before any reliever medication.
Can I rely on this calculator instead of my own personal best?
No. Guidelines recommend using your personal best, the highest reading you can achieve when your asthma is stable and well controlled, as the reference for your action-plan zones, because individual airways differ from population averages. The predicted value here is the right reference when you have never established a personal best, when asthma is newly diagnosed, or when comparing across people. Once you know your personal best, that number replaces the predicted value in the green, yellow and red zone calculations.
Related pulmonology tools
- ABG Analyzer: systematic arterial blood gas interpreter
- Alveolar-Arterial (A-a) Gradient Calculator
- All pulmonology calculators on Doctor With Data
References and further reading
Last medically reviewed 2026-10-05 by Dr. Taimoor Asghar. Equations and interpretation bands verified against the cited sources on 2026-10-05.