SpO2/FiO2 (SF) Ratio Calculator
In short: Free SpO2/FiO2 (SF) ratio calculator: enter SpO2 and FiO2 to get the SF ratio with ARDS-equivalent severity bands from verified cutoffs (Rice 2007, Kigali modification, 2024 Global Definition). Includes an optional estimated PaO2/FiO2, worked examples, and FAQs. Use the calculator above, then read the guide below to interpret your result and its limitations.
Noninvasive oxygenation ratio from pulse oximetry. Enter the SpO2 and the FiO2 recorded at the same moment; the calculator returns the SF ratio, the ARDS-equivalent severity band from verified cutoffs, whether the Kigali oxygenation criterion is met, and an optional estimated PaO2/FiO2 from the published Rice 2007 regression. Thresholds verified against Rice et al. (Chest 2007), Riviello et al. (JAMA 2016), and the 2024 Global Definition of ARDS on 2026-10-05. Medically reviewed by Dr. Taimoor Asghar.
Calculator
70 to 100 percent. The calculator warns if the reading is below 80 (oximeter accuracy degrades) or above 97 (the oxygen-haemoglobin curve is flat there).
0.21 for room air, 1.0 for 100% oxygen. Enter as a decimal, not a percentage. Record it at the same moment as the SpO2.
What the SpO2/FiO2 ratio measures
The SpO2/FiO2 ratio, universally shortened to the SF ratio, is the noninvasive cousin of the PaO2/FiO2 (PF) ratio that has anchored oxygenation assessment in critical care for decades. The PF ratio divides the arterial oxygen tension from a blood gas (PaO2) by the fraction of inspired oxygen (FiO2): a patient with a PaO2 of 90 mmHg on 30 percent oxygen has a PF ratio of 300. The SF ratio does exactly the same arithmetic, but substitutes the pulse oximeter saturation (SpO2) for the arterial blood gas value: the same patient, if their oximeter read 94 percent, would have an SF ratio of 94 divided by 0.30, which is 313. Both ratios answer the same clinical question: how well is the lung getting oxygen into the blood for the amount of oxygen being delivered? The denominator matters as much as the numerator, because a saturation of 94 percent means something entirely different on room air, where it is nearly normal, than on 60 percent oxygen, where it signals serious gas-exchange failure.
The reason the SF ratio exists is practical, not physiologic. The PF ratio is the reference standard, but it demands an arterial blood gas: a painful arterial puncture or an indwelling arterial line, a blood gas analyzer, reagents, and trained staff. Those are not available at every bedside, in every clinic, or in every country. A pulse oximeter, by contrast, is cheap, painless, continuous, and essentially ubiquitous. When the correlation between the two ratios was formally measured in 2007 and found to be strong, the SF ratio moved from a back-of-the-envelope trick to a legitimate clinical instrument: a way to grade hypoxemia and track it over time wherever an oximeter can reach but a blood gas analyzer cannot. To be clear about its standing, and to say it the way the literature says it: the SF ratio is a surrogate that is useful when arterial blood gases are unavailable, as in the Kigali modification of the ARDS definition. It is not a replacement for the PaO2/FiO2 ratio where an arterial blood gas is available.
Three worked examples show how the arithmetic behaves. A healthy adult on room air with SpO2 96 percent: 96 divided by 0.21 equals 457. A patient with SpO2 94 percent on FiO2 0.4: 94 divided by 0.4 equals 235, which is the published anchor point equivalent to a PF ratio of 200. A patient with SpO2 90 percent on FiO2 0.6: 90 divided by 0.6 equals 150, deep in the moderate ARDS-equivalent band and only 2 units above the severe-equivalent cutoff of 148. Notice that the same saturation of 94 percent gives an SF of 447 on room air and 235 on 40 percent oxygen: the FiO2 in the denominator is doing the clinical work, which is why entering the correct FiO2 matters more than getting the SpO2 to one more decimal place.
The Berlin definition and its oxygenation bands
To interpret any SF band honestly, you need the framework it borrows from: the 2012 Berlin definition of the acute respiratory distress syndrome (ARDS). Berlin kept the familiar oxygenation criterion, PaO2/FiO2 of 300 mmHg or less while on at least 5 cmH2O of positive end-expiratory pressure, and it formalized three severity grades by that ratio: mild ARDS for a PF of 201 to 300, moderate ARDS for 101 to 200, and severe ARDS for 100 or less. The oxygenation criterion sits inside a larger definition that also requires acute timing (respiratory failure within about one week of a known clinical insult, or new or worsening respiratory symptoms), bilateral opacities on chest imaging that are not fully explained by pleural effusion, lobar or lung collapse, or nodules, and respiratory failure that is not fully explained by cardiac failure or fluid overload. The severity bands are not decorative: observed mortality rises across them, and they determine eligibility for trials and for escalations of care such as prone positioning and extracorporeal membrane oxygenation.
Berlin's definition is precise, but it assumes a well-equipped intensive care unit. Every element except the timing clause can be hard to obtain in a low-resource hospital: arterial blood gases need an analyzer, PEEP needs a ventilator, and the imaging criterion needs radiology. That gap between the definition and the world's bedsides is exactly what motivated the Kigali modification, and it is the reason the SF ratio needed its own verified severity bands rather than a hand-waving "low is bad" reading. The bands this calculator uses are those oxygenation equivalents, and every number in them traces to a published source rather than to interpolation by the author.
Reading your result: the severity bands
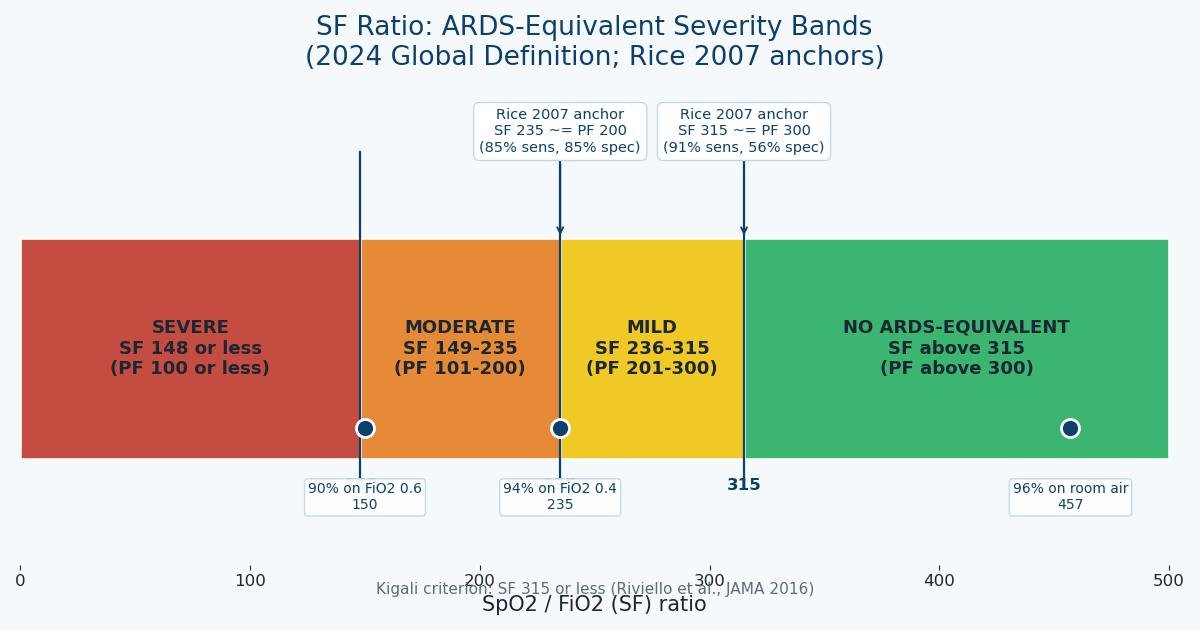
The bands come from the 2024 Global Definition of ARDS, which mapped the Berlin PF severity grades onto SF cutoffs:
| SF ratio | ARDS-equivalent band | Rough PF equivalent |
|---|---|---|
| Above 315 | No ARDS-equivalent hypoxemia | PF above 300 |
| 236 to 315 | Mild ARDS-equivalent | PF 201 to 300 |
| 149 to 235 | Moderate ARDS-equivalent | PF 101 to 200 |
| 148 or less | Severe ARDS-equivalent | PF 100 or less |
Read the table with the Rice anchor points in mind. An SF of exactly 315 is the Rice cutoff that predicts a PF of 300 (with 91 percent sensitivity and 56 percent specificity), and it is also the Kigali oxygenation cutoff, so the calculator flags SF values of 315 or less as meeting the Kigali criterion. An SF of exactly 235 is the Rice cutoff that predicts a PF of 200 (85 percent sensitivity, 85 percent specificity), the boundary between the mild and moderate bands. An SF of 148 is the severe-equivalent cutoff, and values near it are flagged because a ratio of 150, as in the worked example of 90 percent on FiO2 0.6, is formally moderate but clinically adjacent to severe. The phrase "ARDS-equivalent" is doing deliberate work in every label: the ratio grades the oxygenation criterion only, and a full ARDS assessment still needs the timing, imaging, and cardiac-exclusion clauses of the definition.
A final caution on reading single values: oxygenation is a moving target. A patient whose SF ratio falls from 380 to 320 over a shift has crossed into the mild ARDS-equivalent band and, more importantly, has deteriorated; a patient sitting stable at 240 on unchanged support is a different clinical story than one who arrived at 240 an hour ago from 160. The bands classify the moment, but the trend tells the story, which is why a ratio that can be recomputed painlessly from an oximeter has practical value beyond any single cutoff.
SF versus PaO2/FiO2: a surrogate, not a substitute
The numbers behind this calculator come from Rice and colleagues, who studied 256 patients enrolled in ARDS Network trials and compared SpO2/FiO2 with PaO2/FiO2 measured within five minutes of each other (Chest, 2007). The two ratios correlated with a coefficient of 0.89, and the linear regression was SF = 64 + 0.84 x PF. From receiver-operating-characteristic analysis, an SF of 235 predicted a PF of 200 or less with 85 percent sensitivity and 85 percent specificity, and an SF of 315 predicted a PF of 300 or less with 91 percent sensitivity and 56 percent specificity. Note the asymmetry in the second pair: 56 percent specificity means a fair number of patients with an SF of 315 or less actually had a PF above 300, so the mild band is a sensitive screen rather than a precise classifier. Later studies in other populations landed in the same neighborhood: a COVID-19 pneumonia cohort found SF values of 219 and 299 corresponding to PF values of 200 and 300, close to the Rice anchors.
Because the regression equation is published and verified, this calculator offers an optional estimated PaO2/FiO2 on the result page, computed by inverting the Rice equation: estimated PF = (SF - 64) / 0.84. It is labelled as a rough estimate everywhere it appears, because that is what it is. The equation was fitted to a specific population of ventilated ARDS Network patients, and the 2024 limitations literature shows that individual-level disagreement between SF-based and PF-based severity classification is substantial: a 2025 multicenter observational cohort reported notable misclassification when patients were sorted into severity bands by SF versus by PF. Treat the estimate as a ballpark that helps you think in PF units, and never as a value you would titrate therapy against. Where an arterial blood gas is available, the measured PF ratio is the reference standard, full stop.
That hierarchy matters for the page's honest headline. The Kigali modification of the Berlin definition (Riviello and colleagues, JAMA, 2016) showed that ARDS epidemiology and bedside recognition could be done without arterial blood gases at all: in a Rwandan referral hospital, defining hypoxemia as SF of 315 or less, dropping the PEEP requirement, and accepting lung ultrasound for the imaging criterion identified ARDS in 4 percent of hospital admissions, with a hospital mortality of 50 percent, patients who would otherwise have been invisible to the Berlin definition. The 2024 Global Definition of ARDS then brought SF thresholds into the mainstream definition itself. The through line of this literature is consistent: use the SF ratio confidently where it extends your reach, and defer to the arterial blood gas where you have one.
Limitations of pulse oximetry and how FiO2 changes the ratio
Pulse oximetry is a superb monitor and an imperfect measuring instrument, and the SF ratio inherits both qualities. Start with the low end. Pulse oximeter accuracy degrades as saturation falls, and below about 80 percent most devices lose the precision that the upper ranges enjoy, which is why the calculator attaches an explicit caution to any SpO2 under 80 and why an arterial blood gas is the better choice in that zone. The devices are typically validated down to 70 percent, which sets the lower bound of this calculator, but "validated" and "precise" are not the same thing at the bottom of the range. Accuracy is also affected by poor peripheral perfusion, motion artifact, and skin pigmentation, and the literature has documented that oximeters can overestimate true arterial saturation in some patients, which would make an SF ratio look falsely reassuring.
At the top end, the problem is physics rather than engineering. The oxygen-haemoglobin dissociation curve is nearly flat above about 97 percent saturation, so a saturation of 98 percent can correspond to a wide range of arterial oxygen tensions; the SF/PF relationship that Rice measured simply stops discriminating there. Rice and subsequent investigators handled this by restricting their analyses to SpO2 at or below 97 percent, and this calculator carries the same caveat as a visible warning: a high saturation on a high FiO2 can hide a PF ratio that is much worse than the SF ratio suggests. A related practical point is lag: the oximeter reports what the blood looked like some seconds ago, not this instant, so during rapid changes the number on the screen and the patient's current state can briefly disagree.
Then there is the denominator. The FiO2 entered must be the one in effect at the moment the SpO2 was recorded; a ratio built from a saturation taken on 60 percent oxygen and an FiO2 remembered from an hour earlier is arithmetic, not assessment. Where the device displays FiO2 directly, as with venturi masks, high-flow nasal cannula, and ventilators, use the displayed value. On a standard nasal cannula the delivered FiO2 is not set directly, and a commonly taught bedside approximation adds roughly 4 percentage points of FiO2 per liter of flow above room air: about 24 percent at 1 liter, 28 percent at 2 liters, and so on. That rule is approximate because the true delivered FiO2 varies with the patient's breathing pattern and peak inspiratory flow, so an SF ratio computed from an approximated FiO2 is itself approximate. When the ratio drives real decisions, the FiO2 should be known, not guessed.
When clinicians use the SF ratio
Given its limits, where does the SF ratio actually earn its place? The first answer is the one the Kigali investigators gave: anywhere arterial blood gases are scarce, which includes much of the world's hospital care and some corners of well-resourced systems too, such as general wards and emergency departments where ABGs are not drawn routinely. The second answer is screening and early warning. Festic and colleagues showed that the admission SF ratio predicted the development of ARDS among at-risk hospitalized patients, and rapid-response studies have used SF cutoffs (around 170 as a rule-in point and 300 as a rule-out point for ICU transfer in one cohort) to flag deteriorating ward patients for escalation. Because the ratio needs only an oximeter and a known FiO2, it can be recomputed as often as vital signs are taken, which makes it a natural trend variable on observation charts.
The third answer is research and scoring. Pandharipande and colleagues derived and validated the SF ratio specifically to impute the respiratory component of the SOFA score when PaO2 was unavailable, which is how the ratio entered large database studies and quality registries. The COVID-19 pandemic then stress-tested it at scale: with wards full of hypoxemic patients and blood gas analyzers rationed, SF-based triage and monitoring became routine, and the correlation held up in COVID pneumonia cohorts as noted above. For anyone following that literature, one more honest note: the ratio performs best as a population-level and trend-level tool, and individual values near a cutoff deserve the boundary caution this calculator attaches. A ratio of 150 in a patient who was 400 yesterday is an emergency regardless of which band the table assigns it.
For readers working through related oxygenation calculations, the A-a oxygen gradient calculator covers the alveolar-arterial gradient from arterial blood gas values, which answers the complementary question of where hypoxemia is coming from rather than how severe it is. The pulmonology calculator index lists the full set.
Sources
Thresholds, equations, and study findings on this page were verified against the following sources on 2026-10-05; every cutoff in the calculator traces to one of them:
- Rice TW, Wheeler AP, Bernard GR, Hayden DL, Schoenfeld DA, Ware LB; NIH NHLBI ARDS Network. Comparison of the SpO2/FiO2 ratio and the PaO2/FiO2 ratio in patients with acute lung injury or ARDS. Chest. 2007;132:410-417. (SF = 64 + 0.84 x PF, r = 0.89; SF 235 predicts PF 200 with 85%/85%; SF 315 predicts PF 300 with 91%/56%.) The regression equation and anchor values are restated in the open-access review at https://criticalcarescience.org/wp-content/uploads/sites/7/articles_xml/1982-4335-rbti-34-01-0185-20013/1982-4335-rbti-34-01-0185-20013-en.pdf and in Kumar et al., Med Intensiva. 2022, https://www.medintensiva.org/en-correlation-spo2-fio2-s-f-ratio-pao2-fio2-articulo-S0210569121002692.
- Riviello ED, Kiviri W, Twagirumugabe T, et al. Hospital incidence and outcomes of ARDS using the Kigali modification of the Berlin definition. JAMA. 2016. (Hypoxemia defined as SpO2/FiO2 of 315 or less; no PEEP requirement; lung ultrasound accepted; 4% of admissions met criteria, 50% hospital mortality.) Described in the open-access commentary at https://jtd.amegroups.org/article/view/7224/html and summarized with the Berlin and Matthay criteria at https://www.mdpi.com/2077-0383/12/3/1043.
- Global Definition of ARDS (2024): severity bands No ARDS (SF above 315), Mild (SF above 235 to 315), Moderate (SF above 148 to 235), Severe (SF 148 or less), reproduced with the paired PF bands in Table 1 of the open-access cohort study at https://pmc.ncbi.nlm.nih.gov/articles/PMC11837723/, which also reports the individual-level misclassification between SF-based and PF-based severity assignment.
- Ranieri VM, Rubenfeld GD, Thompson BT, et al. Acute respiratory distress syndrome: the Berlin definition. JAMA. 2012;307:2526-2533. (PF 300 or less on PEEP 5 or more; mild 201-300, moderate 101-200, severe 100 or less; timing and imaging clauses.)
Key takeaways
- There is no single normal value because the ratio depends on the FiO2 in the denominator.
- The two ratios track each other closely.
- No.
- Below about 80 percent, pulse oximeter accuracy degrades noticeably, so a ratio built on that reading is less trustworthy and an arterial blood gas is preferable.
Frequently asked questions
What is a normal SpO2/FiO2 ratio?
There is no single normal value because the ratio depends on the FiO2 in the denominator. On room air (FiO2 0.21), a healthy saturation of 96 to 99 percent gives an SF ratio of roughly 457 to 471, well above the ARDS oxygenation cutoff of 315. The same saturation of 94 percent is an SF of about 447 on room air but only 235 on FiO2 0.4, which is the moderate ARDS-equivalent band. Read the ratio against the severity bands, not against one fixed number.
How does the SF ratio relate to the PaO2/FiO2 ratio?
The two ratios track each other closely. In the Rice 2007 study of 256 ARDS Network patients, the correlation coefficient was 0.89 and the linear regression was SF = 64 + 0.84 x PF. The study found that an SF of 235 predicts a PF of 200 (with 85 percent sensitivity and 85 percent specificity) and an SF of 315 predicts a PF of 300 (with 91 percent sensitivity and 56 percent specificity). The optional estimated PF shown on the result uses this published equation and is a rough guide, not a measured value.
Can the SF ratio diagnose ARDS?
No. ARDS diagnosis requires the full definition: respiratory failure within about one week of a known insult, bilateral opacities on imaging not fully explained by effusion, collapse, or nodules, and respiratory failure not fully explained by cardiac failure or fluid overload, plus the oxygenation criterion. The SF ratio supplies only the oxygenation piece, which is where it earns its place when arterial blood gases are unavailable (the Kigali modification and the 2024 Global Definition of ARDS both formalize this). A low SF ratio alone is never a diagnosis.
Why does the calculator warn when my SpO2 is below 80 percent or above 97 percent?
Below about 80 percent, pulse oximeter accuracy degrades noticeably, so a ratio built on that reading is less trustworthy and an arterial blood gas is preferable. Above 97 percent the oxygen-haemoglobin dissociation curve is flat, meaning very different arterial oxygen tensions can share the same saturation, so the SF/PF relationship becomes unreliable. The studies that validated the SF/PF correlation, including Rice 2007, restricted their analyses to SpO2 at or below 97 percent for exactly this reason.
What FiO2 should I enter if the patient is on a nasal cannula?
Use the FiO2 shown on the delivery device whenever it is known (venturi masks and high-flow systems display it directly). On a standard nasal cannula the delivered FiO2 is not set directly; a commonly taught bedside approximation adds roughly 4 percentage points per liter of flow above room air, about 24 percent at 1 L, 28 percent at 2 L, and so on, though the true value varies with breathing pattern and is only approximate. Whatever source you use, record the SpO2 and the FiO2 at the same moment, because a ratio computed from mismatched time points is meaningless.
Does an SF ratio above 315 rule out ARDS or lung injury?
No. Above 315 means the oxygenation criterion for ARDS is not met at that moment, but early ARDS can present with preserved oxygenation, and the SF/PF relationship is weakest at high saturations where the curve flattens. Trends over time and the other definitional criteria (timing, imaging, exclusion of cardiac causes) carry more weight than any single ratio value. A deteriorating ratio that is still above 315 deserves attention, not reassurance.
References and further reading
Medical disclaimer. This calculator is an educational tool, not medical advice. The SF ratio is one piece of the oxygenation picture and must be interpreted together with the full clinical context, including imaging, timing, and the exclusion of cardiac causes, by a qualified clinician. Do not use it to diagnose, treat, or make decisions about any medical condition. If you or someone else has breathing difficulty, seek urgent medical care.