P-POSSUM Calculator: Predicted Operative Mortality and Morbidity
In short: P-POSSUM (Portsmouth POSSUM) predicts 30-day operative mortality and morbidity from 12 physiological and 6 operative factors (Prytherch et al. 1998). Enter each graded factor to get the physiological score, operative score and predicted risks, with a worked example and the full scoring tables. Use the calculator above, then read the guide below to interpret your result and its limitations.
P-POSSUM (Portsmouth Physiological and Operative Severity Score for the enUmeration of Mortality and morbidity) predicts the risk of death and of complications within 30 days of surgery. Grade each of the 12 physiological factors and the 6 operative factors below using the 1, 2, 4 or 8 scale defined by Copeland and colleagues, and the calculator will compute the physiological score, the operative score, the predicted 30-day mortality from the Prytherch 1998 equation, and the predicted morbidity from the original POSSUM morbidity equation. This tool is for surgical planning and audit support only; it must not override clinical judgment.
Mortality: ln(R/(1-R)) = -9.37 + 0.19 x physiological score + 0.15 x operative score (Prytherch et al. 1998). Morbidity: ln(R/(1-R)) = -5.91 + 0.16 x physiological score + 0.19 x operative score (Copeland et al. 1991). R = e^logit / (1 + e^logit).
Worked example
A 65-year-old man is scheduled for an elective major bowel resection for a primary colonic tumour. His assessment shows: no cardiac failure; no dyspnoea; systolic blood pressure 140 mmHg; pulse 90 per minute; Glasgow coma score 15; haemoglobin 12.0 g/dL; white cell count 8 x 10^9/L; urea 8 mmol/L; sodium 138 mmol/L; potassium 4.0 mmol/L; normal electrocardiogram. Grading these gives 2 for age, 1 for cardiac signs, 1 for respiratory signs, 2 for blood pressure, 2 for pulse, 1 for Glasgow coma score, 2 for haemoglobin, 1 for white cell count, 2 for urea, 1 for sodium, 1 for potassium and 1 for the electrocardiogram, for a physiological score of 17.
The operation is a major resection (4 points), a single procedure (1 point), with estimated blood loss of 300 mL (2 points), no peritoneal soiling (1 point), a primary tumour only (2 points), performed electively (1 point): an operative score of 11.
Mortality: logit = -9.37 + 0.19 x 17 + 0.15 x 11 = -9.37 + 3.23 + 1.65 = -4.49. Then R = e^-4.49 / (1 + e^-4.49), about 0.0111, or 1.11 percent. Morbidity: logit = -5.91 + 0.16 x 17 + 0.19 x 11 = -5.91 + 2.72 + 2.09 = -1.10. Then R = e^-1.10 / (1 + e^-1.10), about 0.2497, or 25.0 percent. So the model predicts roughly a 1 in 90 chance of death and a 1 in 4 chance of a complication within 30 days: a routine elective case with a modest but real risk profile, exactly the kind of number that belongs in a consent discussion and in planning the level of postoperative care. You can reproduce this result in the calculator above by selecting the matching grade for each factor.
What P-POSSUM is and where it came from
POSSUM, the Physiological and Operative Severity Score for the enUmeration of Mortality and morbidity, was introduced by Copeland and colleagues in 1991 in the British Journal of Surgery. Its purpose was explicitly comparative: to let surgeons, hospitals and health systems compare their outcomes fairly by adjusting for how sick the patients were and how large the operations were. Before risk adjustment, a unit that took on difficult emergency cases would always look worse than one that selected fit elective patients; POSSUM gave the field a common currency for predicted risk so that observed deaths and complications could be judged against expected numbers. The system scores 12 physiological variables measured around the time of surgery and 6 variables describing the operation itself, grading each on an exponential scale of 1, 2, 4 or 8, then combines the two sums in logistic regression equations.
The original equations worked, but they had a conspicuous flaw: they overpredicted death. A review in the Saudi Journal of Anaesthesia summarised the problem as overprediction by a factor of two in high-risk patients, a factor of six in low-risk patients (predicted risk at or below 10 percent), and a factor of seven in very low-risk patients (predicted risk at or below 5 percent). Overprediction matters for audit because it makes every unit look better than it is, and it matters for patients because inflated risk estimates distort consent.
In 1998, Prytherch and colleagues at Portsmouth published the revision now called P-POSSUM (Portsmouth POSSUM). They kept the exact same 18 variables and grading, but re-derived the mortality equation using linear analysis, producing ln(R/(1-R)) = -9.37 + 0.19 x physiological score + 0.15 x operative score (British Journal of Surgery, DOI 10.1002/bjs.1800850512). Prospective testing showed the predicted mortality tracked observed in-hospital mortality closely. Note what the revision did not change: the morbidity equation is still the original POSSUM one, and P-POSSUM itself is not validated for morbidity prediction. This calculator follows that convention, pairing the P-POSSUM mortality equation with the original POSSUM morbidity equation.
The two equations
Both equations are logistic. The quantity ln(R/(1-R)) is called the logit of the risk R; it maps a probability between 0 and 1 onto the whole real line, which is what lets a simple linear combination of scores produce a valid probability. Once the logit is computed, the risk is recovered with R = e^logit / (1 + e^logit) and expressed as a percentage.
PS is the physiological score, the sum of the 12 physiological grades; OS is the operative score, the sum of the 6 operative grades. The mortality equation is the P-POSSUM revision of Prytherch et al. 1998; the morbidity equation is the original POSSUM equation of Copeland et al. 1991, retained because the Portsmouth revision addressed mortality only.
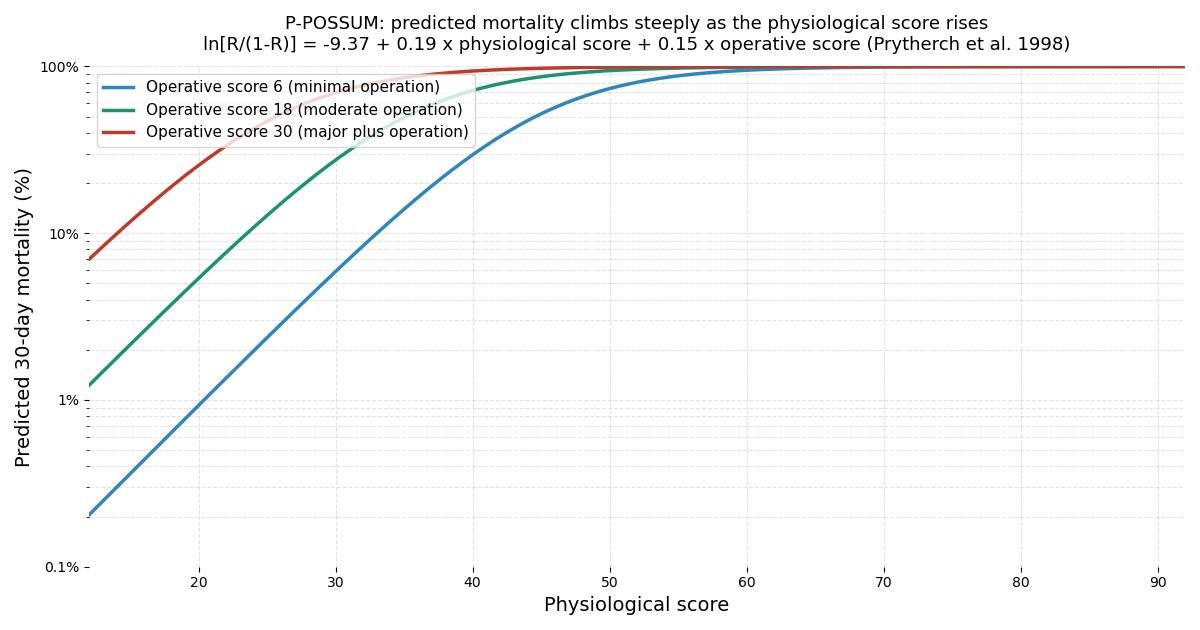
A useful sanity check is the floor of the model. If every factor is normal, PS = 12 and OS = 6. The mortality logit is then -9.37 + 2.28 + 0.90 = -6.19, giving R of about 0.0021, or 0.2 percent. The morbidity logit is -5.91 + 1.92 + 1.14 = -2.85, giving R of about 0.0547, or 5.5 percent. So even the fittest patient having the smallest operation carries a modelled mortality near two in a thousand and a modelled morbidity near one in eighteen, which reflects the irreducible background risk of anaesthesia and surgery. From that floor, risk climbs steeply: the chart above uses a logarithmic vertical axis precisely because the curve spans three orders of magnitude.
The 12 physiological factors
The physiological score is built from measurements taken at the time of surgery. Each factor is graded 1, 2, 4 or 8 according to the cutoffs below, and the 12 grades are added. Two factors have fewer than four grades: white cell count has no grade 8, and the electrocardiogram has no grade 2. If a value is genuinely unavailable, the convention used by the POSSUM calculators at riskprediction.org.uk is to assign grade 1, the normal value, rather than to guess.
| Factor | 1 point | 2 points | 4 points | 8 points |
|---|---|---|---|---|
| Age (years) | 60 or below | 61 to 70 | 71 to 80 | 81 or above |
| Cardiac signs | No failure | Diuretic, digoxin, antianginal or antihypertensive therapy | Peripheral oedema, warfarin therapy, borderline cardiomegaly on chest radiograph | Raised jugular venous pressure, cardiomegaly |
| Respiratory signs | No dyspnoea | Dyspnoea on exertion | Limiting dyspnoea (one flight) | Dyspnoea at rest (rate over 30 per minute) |
| Systolic blood pressure (mmHg) | 110 to 130 | 131 to 170, or 100 to 109 | 171 or above, or 90 to 99 | 89 or below |
| Pulse (per minute) | 50 to 80 | 81 to 100, or 40 to 49 | 101 to 120 | 121 or above, or 39 or below |
| Glasgow coma score | 15 | 12 to 14 | 9 to 11 | 8 or below |
| Haemoglobin (g/dL) | 13.0 to 16.0 | 11.5 to 12.9, or 16.1 to 17.0 | 10.0 to 11.4, or 17.1 to 18.0 | Below 10.0, or above 18.0 |
| White cell count (x 10^9/L) | 4.0 to 10.0 | 10.1 to 20.0, or 3.1 to 3.9 | 20.1 or above, or 3.0 or below | No grade 8 |
| Serum urea (mmol/L) | 7.5 or below | 7.6 to 10.0 | 10.1 to 15.0 | 15.1 or above |
| Serum sodium (mmol/L) | 136 or above | 131 to 135 | 126 to 130 | 125 or below |
| Serum potassium (mmol/L) | 3.5 to 5.0 | 3.2 to 3.4, or 5.1 to 5.3 | 2.9 to 3.1, or 5.4 to 5.9 | 2.8 or below, or 6.0 or above |
| Electrocardiogram | Normal | No grade 2 | Atrial fibrillation, rate 60 to 90 per minute | Any other abnormal rhythm, 5 or more ectopic beats per minute, Q waves or ST/T changes |
A few of these deserve comment. The cardiac and respiratory grades are clinical descriptions, not numbers, which is why POSSUM needs a clinician rather than a laboratory feed: peripheral oedema or limiting dyspnoea is a bedside judgment. Both low and high extremes of blood pressure, pulse, haemoglobin, sodium and potassium score badly, because the scale penalises deviation from normal in either direction. The white cell count is the only factor capped at grade 4, and the electrocardiogram jumps from normal (1 point) to atrial fibrillation at a controlled rate (4 points) to anything worse (8 points), with no grade 2 in between.
The 6 operative factors
The operative score describes the insult of the operation itself. Operative severity follows the standard minor, moderate, major and major-plus classification; peritoneal soiling and malignancy are graded by what the surgeon finds; and mode of surgery distinguishes elective cases from two emergency tiers. Two factors skip a grade: multiple procedures runs 1, 4, 8 and mode of surgery runs 1, 4, 8.
| Factor | 1 point | 2 points | 4 points | 8 points |
|---|---|---|---|---|
| Operative severity | Minor | Moderate | Major | Major plus (complex major) |
| Multiple procedures | 1 | No grade 2 | 2 | More than 2 |
| Total blood loss | 100 mL or less | 101 to 500 mL | 501 to 999 mL | 1000 mL or more |
| Peritoneal soiling | None | Minor (serous fluid) | Local pus | Free bowel content, pus or blood |
| Presence of malignancy | None | Primary tumour only | Nodal metastases | Distant metastases |
| Mode of surgery | Elective | No grade 2 | Emergency: resuscitation over 2 hours possible, operation within 24 hours of admission | Emergency: immediate surgery needed, within 2 hours |
Because blood loss, soiling and the number of procedures are only known once the operation is under way, P-POSSUM is effectively a postoperative score. That is a deliberate design choice inherited from its audit purpose, and it is also its main practical limitation at the bedside: it cannot be completed during a preoperative clinic visit.
How to read the result
The output is a pair of probabilities for the 30 days after surgery. The mortality figure comes from the P-POSSUM equation and is the better validated of the two; the morbidity figure comes from the original POSSUM equation and should be treated as an indicative estimate, since P-POSSUM was never validated for morbidity. Both are group-level statistics: a predicted mortality of 5 percent means that among one hundred patients with similar scores, about five would be expected to die within 30 days. It does not mean this patient has a personally meaningful 5 percent chance, and it certainly does not predict which five.
The legitimate uses follow from the design. For audit, observed deaths and complications are compared against the sum of predicted risks to judge whether a unit or surgeon is performing as expected. For planning, a high predicted risk supports booking an intensive care bed, arranging senior surgical and anaesthetic cover, and optimising the patient beforehand where time allows. For consent, the numbers give the discussion a quantitative anchor, though they should always be presented alongside the surgeon's judgment and the patient's own values. What the score must never do is make the decision: it is a planning and audit instrument, not a substitute for clinical judgment, and it was never validated as a triage rule for who should or should not be offered surgery.
Validation record and known limitations
P-POSSUM has been one of the most widely studied surgical risk scores since its publication. Its derivation corrected the original POSSUM mortality equation, which overpredicted death by a factor of two in high-risk patients, six in low-risk patients and seven in very low-risk patients according to a review in the Saudi Journal of Anaesthesia, and prospective application of the revised equation produced expected mortality close to observed in-hospital mortality. The system is widely used in the United Kingdom, where it helps guide the use of postoperative resources such as critical care beds, and its 30-day outcome window has become a standard horizon for surgical audit.
The limitations are well documented and should be read before any result is acted on. First, the morbidity prediction is the weak half of the pair: it uses the original 1991 POSSUM equation, and P-POSSUM as a system is not validated for morbidity. Second, several studies have reported that P-POSSUM underestimates mortality in elderly patients and in emergency procedures, the two groups where accurate prediction matters most. Third, the equations were derived from UK general surgical patients in the 1990s; case mix, perioperative care and outcomes have all changed since, so calibration in a modern or non-UK population should be checked locally rather than assumed. That concern is exactly why specialty-specific recalibrations exist: CR-POSSUM for colorectal surgery, V-POSSUM for vascular surgery and O-POSSUM for oesophagogastric surgery each refit the equation to their own population. Fourth, the score needs all 18 factors, and the operative half is unknowable before surgery, which confines it to postoperative audit and planning rather than preoperative decision-making. None of these limitations disqualifies the tool, but together they define its lane: a validated audit and planning instrument whose numbers inform, but never replace, the clinical team.
Key takeaways
- P-POSSUM stands for Portsmouth Physiological and Operative Severity Score for the enUmeration of Mortality and morbidity.
- Both systems use the same 18 factors and the same 1, 2, 4, 8 grading.
- For mortality it uses the P-POSSUM equation from Prytherch et al.
- The physiological score runs from 12 (every factor normal, grade 1) to 92, and the operative score from 6 to 48, so the combined total runs from 18 to 140.
Frequently asked questions
What is the P-POSSUM score?
P-POSSUM stands for Portsmouth Physiological and Operative Severity Score for the enUmeration of Mortality and morbidity. It is a surgical risk tool that combines 12 physiological measurements taken around the time of surgery with 6 descriptors of the operative insult. Each factor is graded 1, 2, 4 or 8, the grades are summed into a physiological score and an operative score, and a logistic equation converts the two scores into a predicted 30-day mortality. It was introduced by Prytherch and colleagues in 1998 as a correction to the original POSSUM system of Copeland and colleagues (1991), which overpredicted death, especially in low-risk patients.
What is the difference between POSSUM and P-POSSUM?
Both systems use the same 18 factors and the same 1, 2, 4, 8 grading. The difference is the mortality equation. Original POSSUM uses ln(R/(1-R)) = -7.04 + 0.13 x PS + 0.16 x OS, which was found to overpredict mortality, in some reports by a factor of six in low-risk patients. P-POSSUM keeps the same data but applies ln(R/(1-R)) = -9.37 + 0.19 x PS + 0.15 x OS, which calibrates much better against observed deaths. For morbidity, both systems use the original equation ln(R/(1-R)) = -5.91 + 0.16 x PS + 0.19 x OS, because P-POSSUM was never validated for morbidity prediction.
Which equations does this calculator use?
For mortality it uses the P-POSSUM equation from Prytherch et al. 1998: ln(R/(1-R)) = -9.37 + 0.19 x physiological score + 0.15 x operative score. For morbidity it uses the original POSSUM morbidity equation: ln(R/(1-R)) = -5.91 + 0.16 x physiological score + 0.19 x operative score. In both cases the predicted risk R is recovered from the logit with R = e^logit / (1 + e^logit) and reported as a percentage.
What are the lowest and highest possible scores?
The physiological score runs from 12 (every factor normal, grade 1) to 92, and the operative score from 6 to 48, so the combined total runs from 18 to 140. The ceilings sit below 12 x 8 and 6 x 8 because a few factors have fewer grades: white cell count has no grade 8, the electrocardiogram has no grade 2, multiple procedures has no grade 2, and mode of surgery has no grade 2. At the floor (scores of 12 and 6) the equations give a predicted mortality of about 0.2 percent and a predicted morbidity of about 5.5 percent; risk rises steeply from there, as the chart on this page shows.
Can P-POSSUM decide whether a patient should have surgery?
No. P-POSSUM was designed for surgical audit, comparing observed and expected outcomes between surgeons, units and time periods, not for bedside go or no-go decisions. It can inform consent discussions and help plan postoperative care such as intensive care bed allocation, but it must not override clinical judgment. It is also a postoperative score in practice: the operative factors (blood loss, peritoneal soiling, number of procedures) are only known once the operation is under way, so it cannot be completed before surgery.
What are the main limitations of P-POSSUM?
Several. It was derived in UK general surgical patients in the 1990s, so its calibration in other populations, eras and specialties needs local validation; specialty variants such as CR-POSSUM, V-POSSUM and O-POSSUM exist for that reason. The morbidity equation is the original POSSUM one, and P-POSSUM itself is not validated for morbidity. Studies have reported that it underestimates mortality in elderly patients and in emergency procedures. Like any logistic model it gives a group-level probability, not an individual fate: a predicted 10 percent mortality means roughly one death in ten similar patients, not that this particular patient has a personally meaningful 10 percent chance.