Gupta Postoperative Respiratory Failure Risk Calculator
In short: Estimate the risk of postoperative respiratory failure with the validated Gupta (Chest 2011) logistic model: procedure type, ASA class, functional status, emergency case, and preoperative sepsis. Use the calculator above, then read the guide below to interpret your result and its limitations.
Estimate the probability of postoperative respiratory failure (mechanical ventilation for more than 48 hours, or unplanned intubation or reintubation within 30 days of surgery) with the validated logistic model of Gupta et al. (Chest 2011), derived from the American College of Surgeons NSQIP multicenter database.
What is postoperative respiratory failure?
Postoperative respiratory failure, usually abbreviated PRF, is one of the most serious pulmonary complications of surgery. In the Gupta model it is defined precisely: the patient needs mechanical ventilation for more than 48 hours after the operation, or undergoes unplanned intubation during or after surgery, or is reintubated after having been extubated, all within 30 days of the operation. Two situations were deliberately excluded from the definition: intubation performed as part of a return to the operating room for another reason, and reintubation after the patient pulled the breathing tube out on their own. These exclusions keep the outcome focused on true respiratory failure rather than on planned or self-inflicted airway events.
PRF matters because it changes the whole trajectory of recovery. Patients who develop it stay in hospital far longer, accumulate many more complications, and die far more often. In the Gupta derivation cohort, 3.1 percent of 211,410 surgical patients developed PRF, and among those patients 25.62 percent died within 30 days, compared with 0.98 percent of patients who did not develop PRF. That mortality gap, a more than 25-fold difference, is the reason preoperative risk estimation exists: when the risk is known before the incision, the surgical team can counsel the patient honestly, optimize what is optimizable, and plan the level of postoperative monitoring in advance.
How the Gupta calculator was developed
The model comes from a 2011 paper in Chest by Himani Gupta, Prateek K. Gupta, Xiang Fang, Weldon J. Miller, Samuel Cemaj, R. Armour Forse, and Lee E. Morrow, from Creighton University in Omaha and the University of Pittsburgh. They used the American College of Surgeons National Surgical Quality Improvement Program, a multicenter prospective database in which trained surgical clinical nurse reviewers abstract data from medical records using strict definitions, with interrater reliability auditing. The 2007 data set, with 211,410 patients from 183 participating academic and community hospitals, served as the training set, and the 2008 data set, with 257,385 patients from 211 hospitals, served as an independent validation set. The data covered men and women and a broad range of procedure types, which was an advance over earlier single-institution studies and the Veterans Affairs studies that had largely studied men.
The analysis started with univariate screening of more than 50 preoperative variables, then used stepwise multivariate logistic regression. A 21-variable model gave the lowest Bayes Information Criterion, but a parsimonious five-variable model lost almost nothing in calibration while being far more practical to use, so the final calculator was built on those five predictors. The c-statistic, the area under the receiver operating characteristic curve, was 0.907 for the full 21-variable model and 0.894 for the five-variable final model in the training set; applied to the independent 2008 data, the five-variable model achieved 0.897. Calibration by the Hosmer-Lemeshow test was excellent in both data sets, meaning predicted probabilities tracked observed event rates closely. The authors also tested second-order interaction terms between surgery type and the other variables and found no substantial interaction, which is why the calculator works as a simple additive model on the log-odds scale.
The final model is a logistic regression: the natural log of the odds of PRF equals an intercept of negative 1.7397 plus the coefficients for the patient’s ASA class, functional status, sepsis status, emergency status, and procedure type, with categorical predictors entered by reference coding. The estimated probability is then e raised to that sum divided by one plus e raised to that sum, expressed as a percentage. The published paper prints every coefficient and its standard error in Table 4, so anyone can reproduce the calculator’s estimates exactly. This page implements those published coefficients unchanged.
The five predictors, explained
Type of surgery. Twenty-one procedure groups were defined by incision site, with hernia surgery as the reference category. The procedure carried the largest differences in risk of any predictor. The highest adjusted odds ratios were for aortic surgery (2.94), foregut and hepatopancreatobiliary surgery (2.64), and brain surgery (2.08). The lowest were for breast surgery (0.07), vein surgery (0.13), and anorectal surgery (0.26). This ordering makes clinical sense: operations near the diaphragm, in the chest, or on the great vessels disturb the mechanics of breathing and are often long and physiologically demanding, while breast and vein surgery barely touch the respiratory system.
Emergency case. Emergency operations roughly doubled the odds of PRF relative to elective cases (the published odds ratio for non-emergency versus emergency is 0.56, so the emergency direction is its reciprocal, about 1.8). Emergency patients arrive unoptimized, often with acute pathology, and there is no time for the usual preoperative preparation, which is why urgency is such a consistent predictor across surgical risk models.
Dependent functional status. Patients were classified as independent, partially dependent, or totally dependent in their activities of daily living. Partial dependence carried an adjusted odds ratio of 2.16 and total dependence 4.07, relative to independence. Poor functional status is a marker of frailty and limited physiologic reserve: patients who cannot fully care for themselves have less capacity to clear secretions, mobilize after surgery, and tolerate the added work of breathing that follows anesthesia and pain.
Preoperative sepsis. Sepsis status was coded as none, systemic inflammatory response syndrome (SIRS), sepsis, or septic shock, with SIRS as the reference group. The adjusted odds ratios were 0.46 for no sepsis, 1.32 for sepsis, and 2.47 for septic shock. An infected, inflamed patient enters the operating room with lungs already primed for injury, and septic shock adds the burden of vasopressor dependence and multiorgan stress, so the steep gradient is expected.
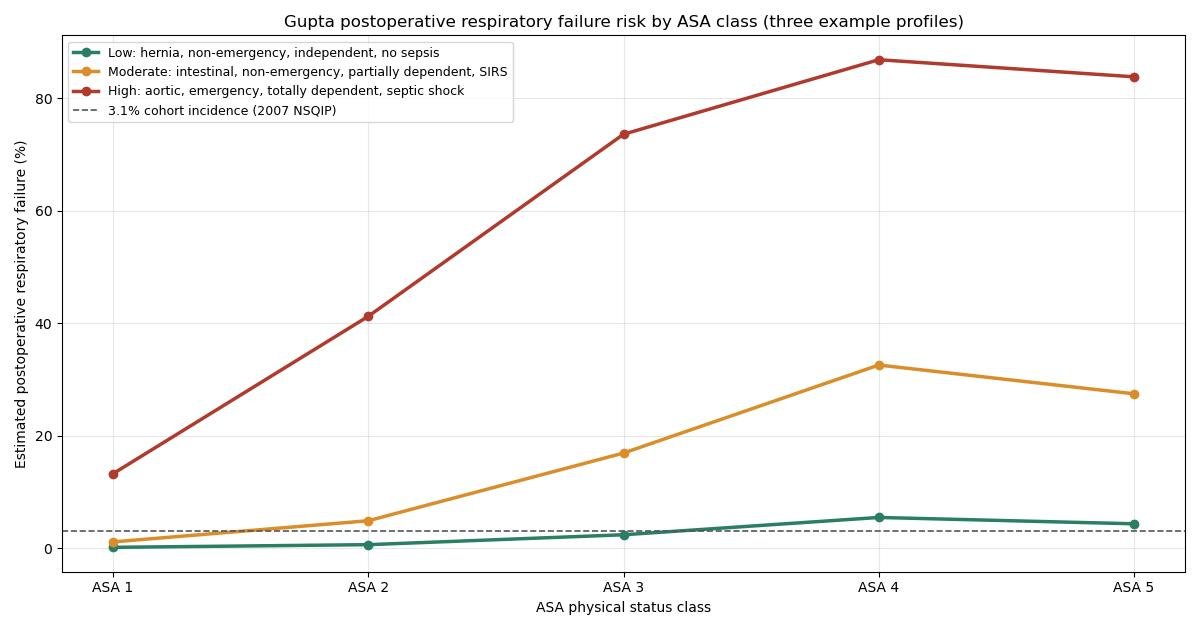
ASA physical status class. Higher ASA class tracked higher PRF risk, with adjusted odds ratios of 0.03 for class 1, 0.14 for class 2, 0.54 for class 3, and 1.28 for class 4, all relative to class 5. One published-model nuance deserves attention: the fitted coefficient for ASA class 4 is slightly above the class 5 reference, so the model estimates marginally higher PRF odds for ASA 4 than for ASA 5. That is what the data showed in this cohort, possibly because moribund ASA 5 patients who proceed to surgery are a selected group, and the calculator implements the published coefficients exactly rather than smoothing them into a forced monotonic staircase.
How to use this calculator
Enter the five preoperative facts. The procedure dropdown lists the same 21 categories used in the study, so pick the closest match to the planned operation. The ASA class is assigned by the anesthesiologist; if you do not know it, the pre-anesthesia note usually records it. Functional status means the patient’s usual level of independence before the current illness: independent if they manage all daily activities alone, partially dependent if they need help with some, totally dependent if they need help with most or all. Emergency means the operation cannot be delayed. For sepsis, choose the worst category that applies on the day of surgery: SIRS is the systemic inflammatory response without a documented infection, sepsis adds the infection, and septic shock adds persistent hypotension despite fluids.
As a worked example, take a patient scheduled for emergency aortic surgery who is ASA class 4, totally dependent, and in septic shock. The log-odds sum is the intercept (negative 1.7397) plus 1.0781 for aortic surgery, 0.2441 for ASA 4, 1.4046 for total dependence, and 0.9035 for septic shock, giving 1.8906; the probability is e to the 1.8906 divided by one plus e to the 1.8906, about 86.9 percent. At the other extreme, an ASA 1, independent, non-emergency breast surgery patient with no sepsis sums to negative 9.2703, a probability of about 0.009 percent. A middle case, ASA 3, independent, SIRS, non-emergency hernia surgery, gives about 5.1 percent. The calculator shows the contribution of each factor so you can see exactly which inputs drive the estimate.
What the risk number means
The output is a model-based probability: among patients in the NSQIP database with this exact combination of inputs, about this percentage developed postoperative respiratory failure. For context, the overall PRF incidence was 3.1 percent in the 2007 derivation cohort and 2.6 percent in the 2008 validation cohort. An estimate well below 3 percent therefore describes a lower-than-average surgical patient; an estimate near 3 percent is roughly average; and an estimate well above it marks a patient in the high-risk tail where extra vigilance is warranted. These comparison points are illustrative, not validated risk classes, because the paper itself did not define risk categories. A probability is not a promise: even a 1 percent estimate means one patient in a hundred has the event, and even an 80 percent estimate leaves one in five unaffected. Use the number to inform judgment, not to replace it.
Clinical uses of the estimate
The authors built the calculator for the informed consent conversation and for surgical decision making. A concrete number helps patients and families grasp what “high risk” actually means, which is the legal and ethical core of consent. It also helps teams plan: a patient with a double-digit estimated risk may merit an ICU bed held in advance, a higher level of postoperative monitoring, or a frank discussion about whether the operation should proceed at all in its planned form. Because the five inputs are all known before the operation, the estimate can also focus preoperative optimization, such as treating active infection, improving nutrition and mobilization where time allows, and planning lung-protective ventilation and analgesia strategies that let the patient breathe deeply and cough after surgery.
Limitations to keep in mind
Every model is a simplification, and this one has limits the authors stated openly. Only preoperative variables were available, so nothing that happens during the operation, such as blood loss, transfusion, or ventilation strategy, can modify the estimate. The derivation data come from US NSQIP hospitals in 2007 and 2008, so practice changes since then and non-US populations may behave differently. Several plausibly relevant variables were not recorded in NSQIP at the time, including obstructive sleep apnea, pulmonary function test results, and hospital case volume. The outcome definition excluded some airway events, such as intubation for a return to the operating room, which means the model predicts its own carefully defined PRF, not every breathing problem after surgery. It was developed in adults and should not be applied to children. Finally, a c-statistic near 0.90 is excellent for discrimination, but no model replaces the surgeon and anesthesiologist who see the whole patient.
Related tools
PRF is only one of several pulmonary outcomes worth estimating. The ARISCAT score predicts a broader composite of postoperative pulmonary complications with seven weighted factors and reports observed event rates per risk class. The Apfel score estimates postoperative nausea and vomiting risk, and the STOP-Bang questionnaire screens for obstructive sleep apnea, a risk factor the NSQIP data of that era did not capture. Gupta’s group published companion calculators from the same NSQIP program: a cardiac risk model after surgery (Circulation 2011) and a postoperative pneumonia model (Mayo Clinic Proceedings 2013), both built with the same logistic-regression approach.
Key takeaways
- Postoperative respiratory failure (PRF) was defined as mechanical ventilation for more than 48 hours after surgery, unplanned intubation during or after surgery, or reintubation after extubation, within 30 days of surgery.
- Five preoperative inputs: the type of surgery (one of 21 procedure categories, from anorectal to vein surgery), the ASA physical status class (1 to 5), preoperative functional status (independent, partially dependent, or totally dependent), whether the case is an emergency, and preoperative sepsis status (none, SIRS, sepsis, or septic shock).
- The model discriminated excellently, with a c-statistic (area under the ROC curve) of 0.894 in the 2007 derivation cohort of 211,410 patients and 0.897 in the independent 2008 validation cohort of 257,385 patients.
- Relative to hernia surgery, the highest-risk procedures were aortic surgery (adjusted odds ratio 2.94), foregut and hepatopancreatobiliary surgery (2.64), and brain surgery (2.08).
Frequently asked questions
What counts as postoperative respiratory failure in the Gupta model?
Postoperative respiratory failure (PRF) was defined as mechanical ventilation for more than 48 hours after surgery, unplanned intubation during or after surgery, or reintubation after extubation, within 30 days of surgery. Intubation performed for a return to the operating room, and reintubation after self-extubation, were not counted.
What information do I need to use the Gupta PRF calculator?
Five preoperative inputs: the type of surgery (one of 21 procedure categories, from anorectal to vein surgery), the ASA physical status class (1 to 5), preoperative functional status (independent, partially dependent, or totally dependent), whether the case is an emergency, and preoperative sepsis status (none, SIRS, sepsis, or septic shock).
How accurate is the Gupta postoperative respiratory failure calculator?
The model discriminated excellently, with a c-statistic (area under the ROC curve) of 0.894 in the 2007 derivation cohort of 211,410 patients and 0.897 in the independent 2008 validation cohort of 257,385 patients. Calibration by the Hosmer-Lemeshow test was excellent in both cohorts.
Which types of surgery carry the highest risk of postoperative respiratory failure?
Relative to hernia surgery, the highest-risk procedures were aortic surgery (adjusted odds ratio 2.94), foregut and hepatopancreatobiliary surgery (2.64), and brain surgery (2.08). The lowest-risk procedures were breast (0.07), vein (0.13), and anorectal (0.26) surgery.
Does the calculator predict my personal risk of respiratory failure?
It gives a model-based probability estimated from more than 200,000 surgical patients. It is a group-level risk estimate, not a personal guarantee, and it should be discussed with the surgeon and anesthesiologist, who weigh factors the model does not include.
What are the main limitations of the Gupta PRF model?
It uses preoperative variables only, so intraoperative events are not captured. It was derived from US NSQIP hospitals in 2007 to 2008, and variables such as obstructive sleep apnea, pulmonary function tests, and hospital volume were not available. It was designed for adults and does not replace clinical judgment.
References
- Gupta H, Gupta PK, Fang X, Miller WJ, Cemaj S, Forse RA, Morrow LE. Development and validation of a risk calculator predicting postoperative respiratory failure. Chest. 2011;140(5):1207-1215. doi: 10.1378/chest.11-0466
- Abstract and study details: Development and validation of a risk calculator predicting postoperative respiratory failure, Medscape / MEDLINE.
- Yunyongying P, et al. Preoperative evaluation and perioperative management (includes NSQIP pneumonia and respiratory failure risk tools). Am Fam Physician. 2019;100(8):499-508. Full text (PDF)
- Gupta PK, Gupta H, Sundaram A, et al. Development and validation of a risk calculator for prediction of cardiac risk after surgery. Circulation. 2011;124(4):381-387.
- Gupta H, Gupta PK, Schuller D, et al. Development and validation of a risk calculator for predicting postoperative pneumonia. Mayo Clin Proc. 2013;88(11):1241-1249.
- American Society of Anesthesiologists
- American College of Surgeons