What is the MELD score?
The Model for End-Stage Liver Disease, usually shortened to MELD, is an objective score that grades the severity of chronic liver disease in adults. It is built from three routine laboratory values: total bilirubin, the international normalised ratio (INR), and serum creatinine. Because every input is a measured number rather than a clinical impression, two clinicians scoring the same patient will arrive at the same result, which made the historical score reproducible. It is not the current United States transplant-allocation formula.
The score ranges from 6 to 40. A higher number means more severe disease and a higher probability of death within the next 90 days without transplantation. Transplant programmes use it to rank waiting-list candidates: when a donor liver becomes available, it is generally offered to the compatible candidate with the highest score, because that person faces the greatest short-term risk. The score therefore serves two purposes at once. It gives patients and families a realistic sense of prognosis, and it gives allocation systems a fair, transparent rule for distributing a scarce resource.
It is important to understand what the score does not do. It does not diagnose liver disease, it does not measure quality of life, and it does not predict how a patient will feel next month. It is a population-derived statistical model, so an individual patient can always do better or worse than the score suggests. Clinicians use it alongside the physical examination, imaging, the trend of laboratory values over time, and complications such as ascites, variceal bleeding and hepatic encephalopathy.
A short history of the score
The story begins in 2000, when Malinchoc and colleagues published the original MELD model in Hepatology. They had set out to predict survival after transjugular intrahepatic portosystemic shunt (TIPS), a procedure that relieves portal hypertension but can precipitate liver failure. Their model combined bilirubin, INR and creatinine with the cause of the underlying liver disease. A year later, Kamath and colleagues at the Mayo Clinic showed that the same three laboratory values, without the disease-etiology term, predicted survival across a much broader population of patients with chronic liver disease. Their 2001 paper in Hepatology, volume 33, issue 2, pages 464 to 470, gave the formula its now familiar form and demonstrated that it predicted three-month mortality with good accuracy.
Then Wiesner and colleagues demonstrated in 2003 that this simplified MELD score accurately predicted three-month mortality among patients on the liver transplant waiting list. On the strength of that evidence, the United Network for Organ Sharing (UNOS) adopted MELD for organ allocation in February 2002, replacing an older system based on waiting time and subjective clinical categories. The change was widely seen as a step toward fairness: the sickest patients, rather than those who had simply been waiting longest, moved to the front of the queue. Later refinements built on this foundation rather than replacing it. In 2008, Kim and colleagues published MELD-Na, which adjusts the score for serum sodium and improves prediction in patients with hyponatraemia. In 2021, the same group published MELD 3.0, which adds serum albumin and female sex and updates the coefficients. This page implements the original MELD score of Kamath et al. 2001, which remains the version most often taught in textbooks and examined in medical training.
The formula, step by step
The calculation is a single equation:
Bilirubin and creatinine are entered in mg/dL. Before the natural logarithms are taken, three adjustments are applied. First, any laboratory value below 1.0 is raised to 1.0, because the natural logarithm of a fraction would be negative and would otherwise distort the score. This single rule sets the minimum possible score: when all three values equal 1.0, every logarithm equals zero and the score is 6.43, which rounds to 6.
Second, creatinine is capped at 4.0 mg/dL, so extreme kidney injury cannot push the score beyond its validated range. Third, if the patient is receiving dialysis, creatinine is set to 4.0 mg/dL outright, since dialysis artificially lowers the measured value and would otherwise hide the true severity of kidney dysfunction. The final result is rounded to the nearest whole number and capped at 40.
Each coefficient reflects how strongly its variable predicted death in the derivation data. INR carries the largest coefficient, 11.2, because impaired clotting is one of the strongest signals of failing liver function. Bilirubin, with a coefficient of 3.78, tracks the liver's ability to clear waste, while creatinine, at 9.57, captures the kidney injury that so often accompanies advanced cirrhosis. The constant 6.43 anchors the score so that normal values produce the minimum score of 6.
How to use this calculator
Gather the three most recent laboratory results: total bilirubin, INR and serum creatinine. If your laboratory reports bilirubin or creatinine in SI units (micromoles per litre), convert them first by dividing bilirubin by 17.1 and creatinine by 88.4. Enter the values in the form above, tick the dialysis box only if the patient is currently receiving dialysis, and press the calculate button. The tool will show the MELD score and the corresponding risk band.
If a field is left empty or contains an invalid value, the calculator will name the problem instead of guessing, because a silently wrong score in this setting could mislead a real decision. All calculation happens inside your browser. No data is sent to any server, stored, or shared, so the tool is safe to use with real patient values on a private device.
Interpreting your result
The MELD literature commonly describes the following 90-day risk bands: scores of 6 to 9 indicate low short-term risk, 10 to 19 rising risk, 20 to 29 high risk, 30 to 39 very high risk, and 40 critical risk. These bands are qualitative summaries of the mortality curve reported in the MELD validation study of Wiesner et al. 2003, and they are consistent with the score ranges used in OPTN allocation guidance, where higher scores mark higher priority. A score in the single digits is reassuring in the short term but still warrants regular follow-up, because liver disease can progress. A score in the twenties or higher should prompt a conversation with a hepatologist about transplant evaluation if that has not already happened.
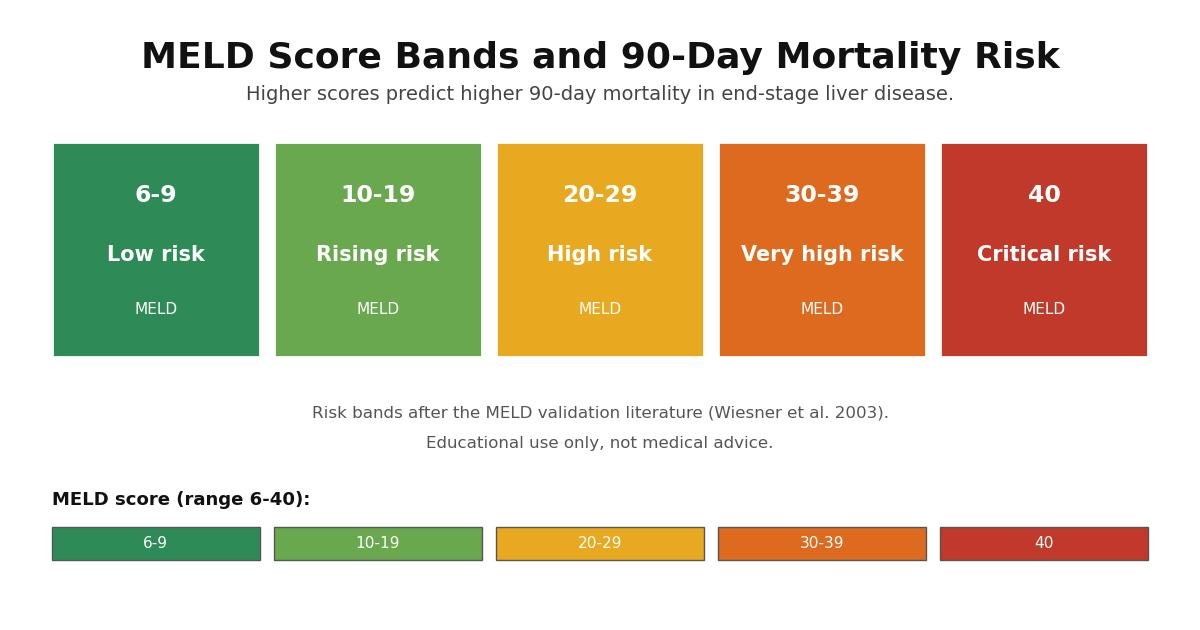
Remember that the bands describe groups, not individuals. Two patients with the same score can have very different outcomes, and a score that falls just on one side of a band boundary is not meaningfully different from a score just on the other side. What matters most is the trend: a score climbing from 12 to 22 over six months tells a clearer story than any single snapshot.
What each input measures
Bilirubin is the yellow pigment produced when old red blood cells are broken down. A healthy liver clears it efficiently, so a rising bilirubin level signals that the liver's excretory function is failing. In advanced cirrhosis, bilirubin climbs as the remaining functional liver tissue shrinks, and very high values often accompany jaundice, dark urine and itching. Because the score uses the natural logarithm of bilirubin, the difference between a bilirubin of 2 and 4 matters more than the difference between 20 and 22, which mirrors how clinicians read the laboratory: early rises carry more new information than late ones.
INR, the international normalised ratio, standardises the prothrombin time across different laboratory reagents so that results are comparable between hospitals. The liver manufactures most clotting factors, so as liver function fails, the blood takes longer to clot and the INR rises. Of the three inputs, INR carries the largest coefficient in the formula, reflecting its strength as a predictor of death in the original derivation study. One caveat: anticoagulant drugs such as warfarin also raise the INR, so the score can overstate liver-related risk in patients taking them, and clinicians interpret such scores with care.
Creatinine reflects kidney function, and its presence in a liver score surprises many people. The explanation is that kidney injury is one of the most ominous developments in advanced cirrhosis. Falling blood pressure in the splanchnic circulation constricts the renal arteries, and the result can be a form of kidney failure called hepatorenal physiology that carries a poor prognosis on its own. By including creatinine, the MELD score captures patients whose liver disease is dragging their kidneys down with it. Creatinine has a weakness as a marker, though: it is a product of muscle metabolism, so patients with low muscle mass, including many women and older adults, can have deceptively low values that understate their true kidney dysfunction.
Limitations you should know
No model fits every patient, and the MELD score has well-documented weaknesses. Beyond the muscle-mass problem with creatinine and the warfarin problem with INR, laboratory methods differ between hospitals, so a score computed from one laboratory's assays may not be exactly comparable with another's. The clamping rules themselves introduce edge effects: a bilirubin of 0.9 and a bilirubin of 1.0 produce identical contributions, by design, because the formula was validated with those rules in place.
The score was derived in adults with chronic liver disease, so it should not be applied to children, for whom the PELD score is used, or to acute liver failure, where the tempo of illness is entirely different. It also captures nothing about complications that do not move the three laboratory values: refractory ascites, recurrent variceal bleeding and severe hepatic encephalopathy can make a patient far sicker than the number suggests. Transplant centres know this, which is why allocation systems allow exception points for conditions the score undervalues, such as hepatocellular carcinoma within defined criteria and portopulmonary hypertension.
Finally, the score is a snapshot. A single MELD value says nothing about trajectory, and clinicians place as much weight on the direction of travel as on the number itself. A stable score of 18 over a year is a different clinical situation from a score that has risen from 10 to 18 in two months, even though the current number is identical.
When clinicians use the MELD score
Beyond transplant waiting lists, clinicians reach for the score in several situations. Before TIPS placement or abdominal surgery in a patient with cirrhosis, the score helps estimate perioperative risk and informs the consent discussion. In the intensive care unit it contributes to triage and goals-of-care conversations when a patient with decompensated cirrhosis deteriorates. Hepatologists track it over time as an objective trend line that complements the clinical examination. Researchers use it to stratify patients in clinical trials so that treatment groups are comparable in disease severity.
Related tools extend the same idea. MELD-Na adjusts the score for serum sodium and improves prediction in patients with hyponatraemia, and MELD 3.0, published by Kim and colleagues in 2021, adds serum albumin and female sex with updated coefficients; the United States allocation system adopted MELD 3.0 in 2023. This page does not calculate current US allocation priority. This page does not calculate current US allocation priority. The calculator on this page implements the original MELD version from Kamath et al. 2001, which remains the reference in most textbooks and in many countries. If your centre quotes a MELD-Na or MELD 3.0 value, ask them to confirm which formula your score follows before comparing it with the result here.
In every setting the score is a starting point for judgment, not a verdict. A patient with a score of 14 and refractory ascites may be sicker than the number suggests, while a patient with a score of 24 driven by a reversible insult such as an infection may improve dramatically once the trigger is treated. The number earns its keep by making the severity explicit and comparable; the clinician earns theirs by interpreting it.